
GA4 Data Pipeline: What Happens to Your GA4 Data Between Collection and Reporting
When a number in your GA4 report looks wrong, the instinct is to question the report.
That’s the wrong place to look.
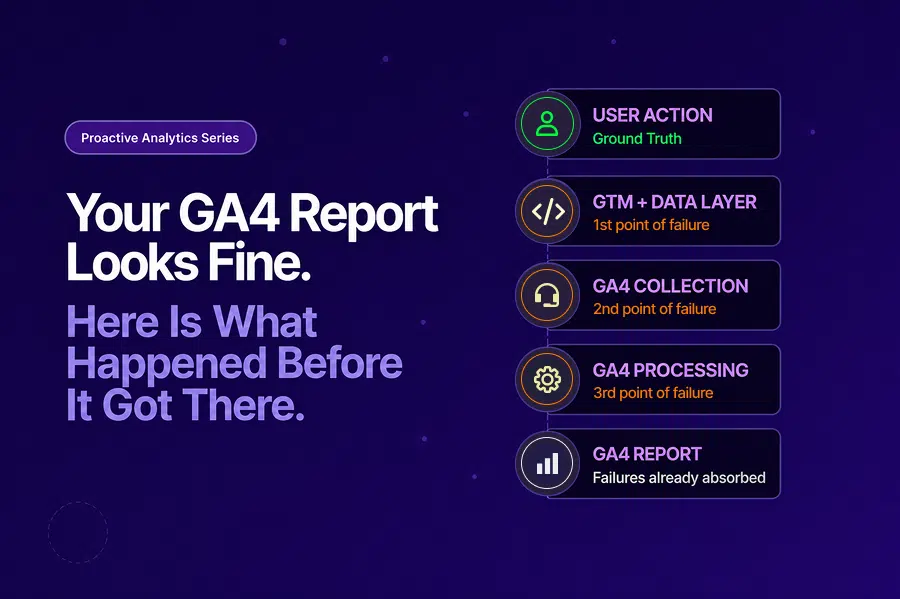
The report is the last stop in a journey that starts the moment a user takes an action on your site. Between that action and the number that appears in your dashboard, your data passes through five distinct stages:
- The user interaction
- The GTM data layer
- GA4 collection
- GA4 processing
- The report itself
At four of those five stages, something can break without any visible signal that it has.
That’s the problem with the GA4 data pipeline that most analytics setups aren’t designed to address. Reactive monitoring watches the report. The breaks happen upstream.
This blog traces that journey stage by stage, names exactly where failures occur, what causes them, and what they look like by the time they reach a report. Understanding the pipeline is the first step toward monitoring it correctly.
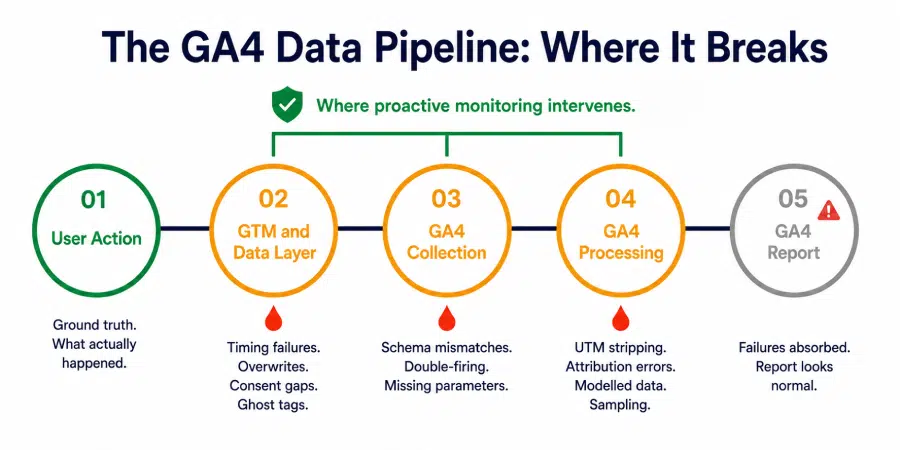
The Five Stages of the GA4 Data Pipeline
Every data point in a GA4 report has passed through this sequence:
Stage 1: User Action
A user clicks, submits, purchases, or navigates. This is the ground truth. Whatever happened here is what the analytics stack is supposed to record.
Stage 2: GTM and the Data Layer
GTM intercepts the user action through triggers, reads values from the data layer, and fires the appropriate GA4 tag with the correct parameters. This is the first point of failure.
Stage 3: GA4 Collection
The GA4 tag sends an event hit to Google’s collection servers. Parameters, values, and event names are received and validated against basic format rules. This is the second point of failure.
Stage 4: GA4 Processing
Google processes the raw hit, applies attribution logic, resolves session boundaries, applies consent mode adjustments, and prepares data for reporting. This is the third point of failure.
Stage 5: GA4 Report
The processed data becomes visible in GA4 reports, explorations, and any downstream tools connected to the property. By this stage, any failure in Stages 2, 3, or 4 has already been absorbed into the numbers. The report looks like a report. It gives no indication of what broke upstream.
Gartner estimates poor data quality costs organizations $12.9 million annually. A significant portion of that cost in GA4 environments comes not from data that was never collected, but from data that was corrupted somewhere between Stage 1 and Stage 5 and reported as if it were accurate.
Stage 2: Where GTM and the Data Layer Break
GTM is where most GA4 data pipeline failures originate. The GTM data layer is the communication channel between your website and your tags. When it breaks, the tags that depend on it fire with wrong values, missing values, or no values at all.
The timing problem
Google’s own data layer documentation is explicit about this: tags that try to access data layer values before those values have been pushed will receive undefined.
A GA4 tag configured to fire on Container Loaded that reads a page_category variable from a data layer push that only occurs after DOM Ready will always send an undefined page_category to GA4. Every event it records will carry that empty parameter.
No error is thrown. The collection happens. The data is just wrong.
The data layer overwrite problem
Re-initialising the data layer after GTM has loaded, during a page transition in a single-page application, breaks the listener that GTM uses to receive events.
- Tags may fail to fire entirely
- Where they do fire, the data layer values they read will be from the wrong application state
- The result is missing events or events recorded with parameters from a previous page
The consent sequencing problem
When tags fire before the consent management platform has loaded and communicated user preferences to GTM, analytics tags can fire without consent being properly checked, or fail to fire at all when they should.
Poor tag sequencing around consent can cause up to 20% data loss in reported traffic, according to industry analysis. Neither outcome is visible in GA4 without parameter-level monitoring.
The GTM container health problem
Publisher and e-commerce sites accumulate tags over time:
- Redundant tags from past campaigns
- Conflicting triggers across implementations
- Ghost tags from vendors no longer in use
These create race conditions, duplicate event fires, and unreliable trigger logic that corrupts the GA4 data pipeline at its source. Continuous GTM health monitoring is specifically designed to catch these container-level failures before they reach GA4 collection.
Stage 3: Where GA4 Collection Breaks
Once a tag fires, the event hit travels to GA4’s collection servers. Failures at this stage are about what’s in the hit, not whether it arrived.
Schema mismatches
GA4 expects parameters to follow the schema defined in your implementation.
- A revenue parameter passing a string value (“1,299”) instead of a numeric value (1299) will either be rejected or stored incorrectly
- A product category parameter passing a value outside the approved taxonomy will record the event in GA4 but assign it to a segment that doesn’t match your intended classification
Both scenarios produce events that look valid in GA4 but carry corrupted parameter values.
Double-firing events
When a trigger is configured incorrectly, or when both enhanced measurement and a custom event are set up to track the same interaction, GA4 receives two hits for one user action.
- Conversion counts inflate
- Revenue figures double
- The report shows numbers that are plausible enough to pass a casual review but are systematically wrong
Data sanity automation catches double-firing by monitoring event count ratios against historical baselines, flagging when a conversion event is being recorded at a rate inconsistent with the session volume that should be generating it.
Missing required parameters
A purchase event that fires without a transaction ID, or a lead event that fires without a form type parameter, is recorded in GA4 but is incomplete for any analysis that segments by those dimensions.
Missing parameters are rarely caught in aggregate metric monitoring because the event itself records correctly. The gap only appears when the data is sliced by the dimension that was never populated.
Stage 4: Where GA4 Processing Breaks
GA4 processing is the stage most businesses understand least, and where silent failures have the widest downstream impact.
UTM parameter stripping in redirects
When a user clicks a paid campaign URL and is redirected through an intermediate URL before reaching the landing page, UTM parameters can be stripped in the redirect.
- The session arrives at the landing page without attribution data
- GA4 assigns it to Direct
- If direct traffic as a percentage of your overall sessions is above 30 to 40%, stripped UTMs are likely a contributor
- The campaign that drove the traffic shows no conversions
Budget decisions follow the attribution, not the reality.
Session attribution logic
GA4’s session attribution model assigns the full session to a single source based on the last non-direct click. When users arrive through multiple touchpoints within a session, or when cross-domain tracking gaps cause session breaks, attribution gets assigned to the wrong source.
The campaign that shows the credit may not be the campaign that earned it.
Consent mode data modelling
When consent mode is active and a portion of users decline analytics consent, GA4 uses modelling to fill in the gaps. The modelled data is an estimate, not a measurement.
In markets or audience segments with high opt-out rates, GA4 models a significant share of conversions and sessions instead of measuring them directly. Google designed consent mode to fill these gaps, so the modelling itself is not a failure. Problems arise when teams misunderstand the role of modelled data and optimize campaigns as though every reported conversion reflects a direct measurement.
Sampling in large properties
GA4 applies sampling thresholds in certain exploration reports and BigQuery exports at scale. When sampled data is used for audience building or conversion analysis without accounting for the sampling rate, the resulting segments and insights are drawn from a subset of actual data.
The anomaly detection layer helps here by flagging when key metric patterns shift in ways that suggest data volume changes, including sampling threshold effects.
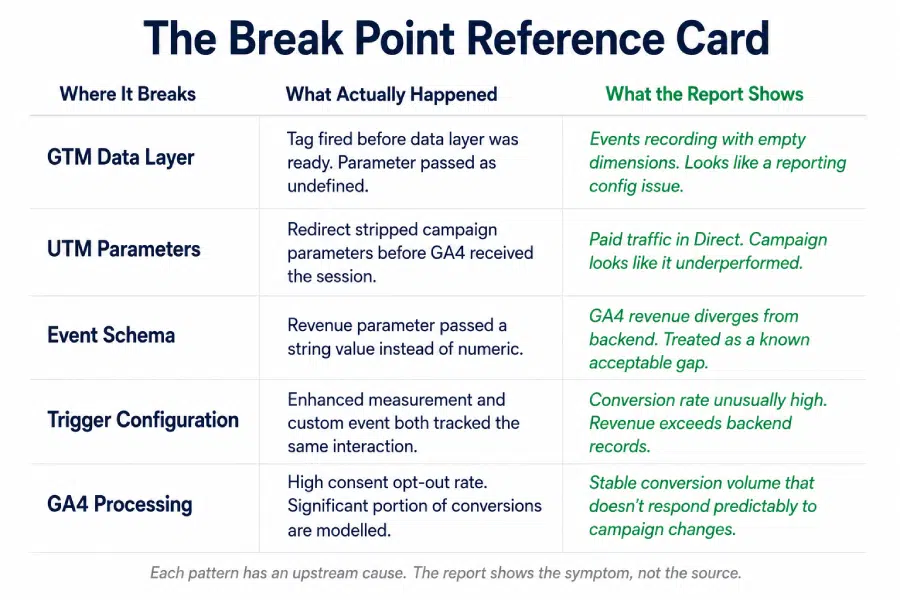
What Each Break Point Looks Like in Your Reports
This is the most important part. Each failure above produces a specific pattern in GA4 reports. Knowing the pattern helps identify the upstream cause.
GTM data layer timing failure
Events record correctly in volume but carry empty or undefined parameter values. Segment-level analysis breaks down because the dimension is unpopulated. Looks like: a reporting configuration problem Actually is: upstream data layer timing failure
UTM stripping in redirects
Direct traffic percentage climbs without a corresponding increase in branded search or type-in traffic. Paid campaign conversion rates drop. Looks like: campaign underperformance Actually is: a redirect configuration stripping query strings
Double-firing conversion events
Conversion rate appears unusually high relative to the site’s actual funnel performance. Revenue figures exceed backend records. Looks like: a strong performance period Actually is: a duplicate trigger producing two hits per user action
Schema mismatch on revenue parameters
Total revenue in GA4 diverges from e-commerce backend figures. The gap is consistent, not random. Looks like: a known discrepancy that gets acknowledged and ignored Actually is: a parameter passing values in the wrong format
Consent mode modelling at high opt-out rates
Conversion volume looks stable but doesn’t respond predictably to campaign changes. Optimisation decisions produce inconsistent results. Looks like: attribution complexity Actually is: a high proportion of modelled data being treated as measured
Each of these has a distinct signature in the data. The GA4 data pipeline failing silently doesn’t mean it’s failing invisibly, if you know what to look for.
Monitoring the Pipeline, Not Just the Report
The reason GA4 data pipeline failures persist is that most monitoring is set up at the wrong end of the journey. Checking the report for anomalies is checking the output of a process that has already completed, potentially with corrupted inputs.
Protecting the GA4 data pipeline requires monitoring at each stage where failures occur:
At the GTM layer
Continuous container health monitoring catches tag sequencing issues, data layer timing failures, and trigger conflicts before they generate corrupted events. This is the earliest intervention point in the pipeline and the highest-leverage one.
At the collection layer
Automated schema validation checks that parameters are passing correct value types and that event counts fall within expected ranges. Double-firing is detectable within hours when event-to-session ratios are monitored with intelligent baselines rather than static thresholds.
At the processing layer
UTM coverage monitoring tracks the percentage of sessions arriving with campaign attribution. When direct traffic rises sharply without a corresponding organic explanation, that’s a redirect or UTM stripping signal worth investigating immediately.
An alert playbook with a named owner for this specific signal type ensures it gets investigated before a week of misattributed campaign data influences budget decisions.
Across the full pipeline
Reconciling GA4 output against backend data sources monthly, comparing GA4 revenue against finance records, and matching GA4 conversion counts against CRM data, closes the loop on what the pipeline produced versus what actually happened.
Discrepancies that survive pipeline monitoring are caught at reconciliation before they propagate into strategy.
In the analytics maturity model, this full-pipeline monitoring capability is what separates Stage 2 from Stage 3. Stage 2 monitors the report. Stage 3 monitors the pipeline that produces it.
Can You Trust Every Stage of Your GA4 Data Pipeline?
Before accepting the next GA4 report as ground truth, consider:
- Do you continuously monitor GTM container health, or do you only review it during implementation updates?
- Do you validate data layer pushes for timing and value accuracy before tags fire?
- Do you automatically check parameter schema compliance across all custom events?
- Do you track direct traffic against a baseline and investigate spikes that may signal UTM stripping?
- Do you regularly reconcile GA4 conversion counts with CRM or backend records?
- When your team identifies a pipeline failure, does a designated owner investigate it within a defined response SLA?
Gaps here mean your GA4 reports are describing a version of user behaviour that may have been partially corrupted before it was ever recorded.
The Takeaway
Your GA4 report is not where data quality is determined. It’s where data quality is revealed, or more often, where it isn’t.
The GA4 data pipeline has four stages between a user action and a report number, and each one is a point where data can break silently. The break doesn’t announce itself. It shows up as:
- A plausible-looking metric that’s wrong
- A campaign that looks like it underperformed
- A conversion rate that seems high
- A direct traffic share that nobody has questioned
Monitoring the report catches problems late. Monitoring the pipeline catches them where they start. That difference, measured in hours rather than weeks, is what separates analytics data you can trust from analytics data you’re hoping is right.
Want to know exactly where your GA4 data pipeline is breaking right now? Tatvic audits your GA4 data pipeline from collection to reporting, identifies gaps in data quality, and helps you build a more reliable analytics foundation.. Schedule a call with Tatvic’s experts today.