
The Analytics Maturity Model: Where Does Your Business Sit?
If you have followed this Proactive Analytics series, you have read about why reactive analytics fails, how to extend your anomaly detection setup, how to build alerts that drive action, and why AI amplifies bad data. Each blog addressed a specific capability. This one takes a step back.
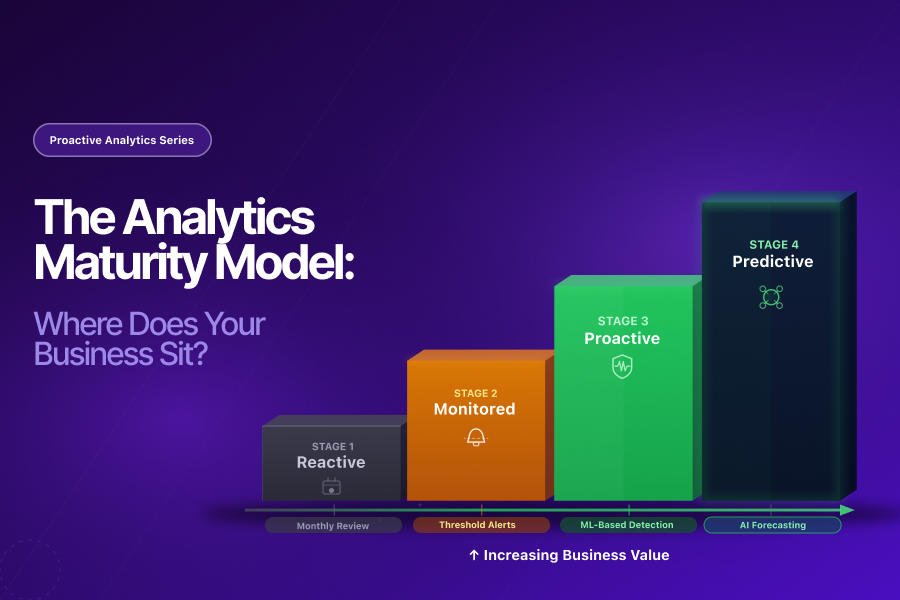
Before investing in any of those capabilities, it helps to know where you are starting from. The analytics maturity model answers that question. It maps out four stages of analytics development, gives you the signals to identify which stage your business is at, and shows what the path forward looks like from each level.
The honest truth is that most businesses are sitting at Stage 1 without knowing it. And the gap between Stage 1 and Stage 3 is not a technology gap. It is a system design gap.
Why Analytics Maturity Matters More Than Analytics Investment
Spending more on analytics tools does not automatically move you up the analytics maturity model. Plenty of businesses have expensive dashboards, GA4 implementations, and BI platforms that still produce insights three weeks after the decisions they should have informed were already made.
McKinsey research puts a number on what mature analytics actually delivers: data-driven organizations are 23 times more likely to acquire customers, 6 times more likely to retain customers, and 19 times more likely to be profitable than those that are not data-driven.
Gartner predicts that by 2026, 65% of B2B sales organizations will transition from intuition-based to data-driven decision-making. But transitioning to data-driven decision-making requires data you can actually trust, delivered at the speed decisions need to be made.
That is exactly what the analytics maturity model measures. Not how much data you collect. How reliably it informs decisions, and how quickly.
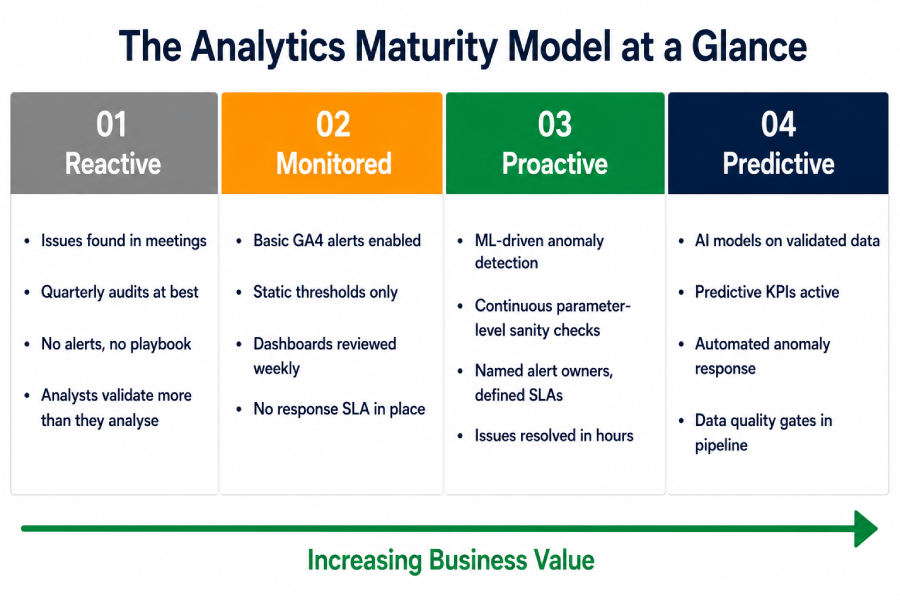
The Four Stages of the Analytics Maturity Model
Stage 1: Reactive
What It Looks Like
Analytics is a reporting function. It tells you what happened after it has already happened. Reports are reviewed weekly or monthly. Data issues surface in stakeholder meetings. Audits happen quarterly, if at all.
The Signals You Are Here
- Last data quality issue was raised by a stakeholder, not an alert
- GA4 custom insights are not enabled or not acted on
- Analysts spend more time validating data than analyzing it
- A known GA4 to CRM discrepancy has existed for weeks
- Campaign decisions are made on unverified data
The Cost
It shows up silently: campaigns scaled on inflated conversion data, budgets pulled from channels that were working, AI models trained on data that was never clean.
Stage 2: Monitored
What It Looks Like
Basic monitoring is in place. GA4 custom insights are enabled. Threshold-based alerts are configured. Dashboards are reviewed weekly. Issues are found within a week, not a month.
The Signals You Are Here
- GA4 custom insights active on key metrics
- Static threshold alerts in place (e.g. “alert when sessions drop 20%”)
- Alerts fire but are often dismissed or ignored
- Metric-level anomalies detected, but not parameter-level issues
- No formal response playbook for alerts received
The Cost
Static thresholds fire during every promotional period and seasonal spike. Teams learn to ignore them. A system nobody trusts eventually protects nothing. Stage 2 is monitored. It is not yet protected.
Stage 3: Proactive
What It Looks Like
Issues are caught before they influence decisions. The monitoring layer is intelligent, contextual, and connected to a response workflow. Resolution is measured in hours, not weeks.
The Signals You Are Here
- Anomaly detection is ML-driven and adapts to seasonal patterns
- Data sanity checks run continuously at the parameter level
- Every alert includes: what changed, by how much, since when, which segment
- Alerts are tiered P1/P2/P3 with named owners and response SLAs
- Attribution patterns monitored for channel credit shifts
The Cost of Not Being Here
Businesses at Stage 2 discover tracking failures in monthly reviews. Businesses at Stage 3 resolve them the same day. That gap is where budget decisions, campaign strategies, and stakeholder reports are built on data that was never reliable.
Stage 4: Predictive
What It Looks Like
Analytics anticipates what is likely to happen, not just what went wrong. AI models are trained on continuously validated data and produce forward-looking signals that inform decisions before the data changes.
The Signals You Are Here
- Predictive metrics (purchase probability, churn, revenue forecasting) are active and acted on
- AI models produce reliable outputs because the data quality foundation is sound
- Anomaly detection extends to AI model input data, not just business KPIs
- Attribution is modeled forward, not just reported backward
- Automated data quality gates built into the collection pipeline
Gartner’s research found that 63% of organizations either do not have or are unsure if they have the right data management practices for AI. Stage 4 requires Stage 3 as its foundation. Organizations that try to skip directly from Stage 1 or Stage 2 to AI-powered analytics are building on unreliable data. Their models will produce outputs that look confident and compound errors at scale.
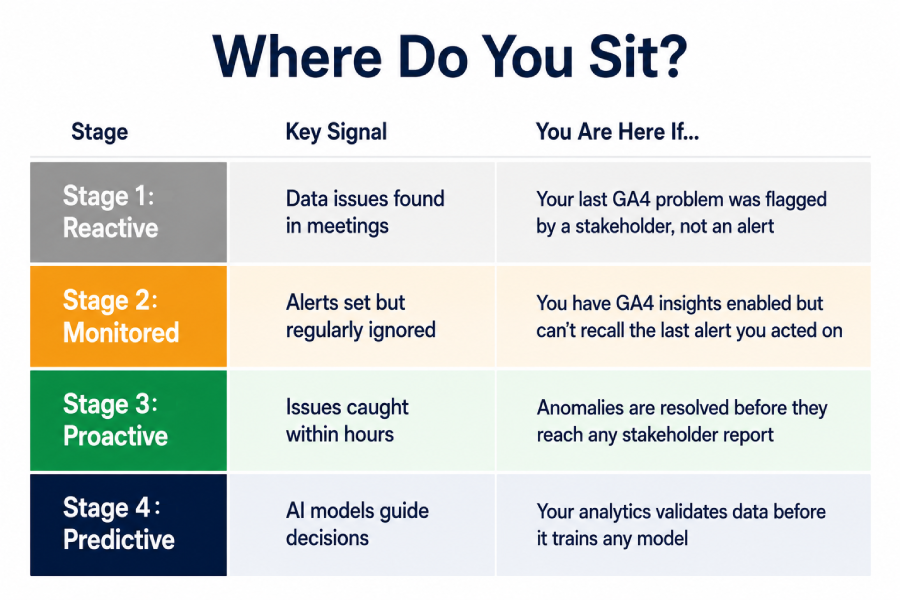
Which Stage Are You At? A Quick Self-Assessment
Be honest with yourself here. Many businesses believe they are at Stage 2 when they are actually at Stage 1. The difference is not what tools you have. It is how those tools are actually being used.
You are at Stage 1 if:
- Data issues are consistently discovered in meetings or stakeholder reviews
- Your last analytics audit was more than 90 days ago
- Analysts spend a significant portion of their time on data validation, not analysis
Stage 2 indicators:
- You have GA4 custom insights enabled but alert on static thresholds
- Teams regularly receive alerts but rarely act on them.
-
Most teams spot issues within a week, not within 24 hours.
Stage 3 signals:
- Anomaly detection is active with adaptive baselines on your highest-value KPIs
- Every alert routes to a named owner with a defined response time
- Data sanity checks run continuously at the parameter level, not just the metric level
You likely operate at Stage 4 when:
- Teams train AI models on continuously validated data
- Predictive metrics actively inform budget and campaign decisions
- Data quality monitoring extends to AI model input data specifically
Most analytics teams reading this will identify themselves at Stage 1 or Stage 2. That is not a failure. It is a starting point.
The Path Forward: Moving Up the Analytics Maturity Model
The single most important thing to understand about the analytics maturity model is that you cannot skip stages. Each stage is the foundation for the one above it.
From Stage 1 to Stage 2: Start with GA4 custom insights. Enable anomaly detection on your three most important KPIs: revenue, primary conversion events, and your top acquisition source. Set a weekly review cadence for anomalies detected. This is the minimum monitoring layer.
From Stage 2 to Stage 3: Replace static thresholds with ML-driven baselines. Add parameter-level data sanity checks. Build an alert playbook: who receives each alert type, what the first action is, and what the escalation path is. This is where proactive analytics begins in earnest.
From Stage 3 to Stage 4: Identify the specific metrics, dimensions, and attribution signals that feed your AI models. Extend monitoring to these specifically. Build automated data quality gates into your collection pipeline. Reconcile AI outputs against verified external sources monthly.
The analytics maturity model does not judge maturity by tools deployed. It judges maturity by the speed and reliability of analytics-driven decisions.
The Takeaway
The analytics maturity model is not a theoretical framework. It is a practical diagnostic. Run through the self-assessment honestly and you will know exactly where your business stands and exactly what needs to change to move up.
The businesses that reach Stage 3 and Stage 4 of the analytics maturity model are not necessarily the ones with the largest analytics budgets. They build each layer with intent. Data collection integrity comes first, followed by anomaly detection and alerting before AI enters the picture.
tyle=”font-weight: 400;”>Get the foundation right and every layer above it becomes more reliable, more actionable, and more valuable.
Not sure which stage of the analytics maturity model your business is at? Tatvic’s team can run a structured analytics audit across your GA4 setup, monitoring configuration, and data collection layer and tell you exactly where you stand and what the path forward looks like. Schedule a call with Tatvic’s experts today.

