
What If Your Team Got a Diagnosis, Not Just an Alert?
The pipeline was fixed. The bad data was caught.
Priya had navigated two back-to-back data incidents in as many weeks – a Monday morning pipeline failure, then a silent attribution error that nearly cost a high-performing campaign its budget. Both resolved. Both slower than they should have been.
Her senior data engineer, Rohan, had diagnosed both. He was methodical and experienced. But even Rohan had spent 40 minutes on the first and nearly two hours on the second.
Neither of those hours were spent fixing anything.
They were spent figuring out what to fix.
On a Thursday afternoon three weeks later, another alert fired. A DAG failure. 3:17 PM.
Rohan opened his laptop.
The Slack notification read: “Pipeline job failed.”
That was all it said.
He opened Cloud Logging in one tab. INFORMATION_SCHEMA in another. DAG run history in a third.
The investigation began.
According to Google’s Site Reliability Engineering guide, alerts that cannot be acted upon generate noise. The guidance is explicit: alerts should be actionable. An alert that tells you something failed – but not what, why, or what it affected – is not actionable. It is the beginning of a manual investigation.
This is the third problem most analytics teams do not solve.
Post 1 of this series covered pipeline failures – jobs that break before anyone notices.
Post 2 covered bad data – wrong numbers that reach dashboards silently.
This post covers what happens after both: the moment an alert fires, and what a team actually does with it.
An alert without context is just noise with urgency attached.
Today’s alerts are like smoke alarms. They tell you something is wrong. But they don’t tell you which room is burning, what caused it, who is inside, or whether the fire already spread.
AI incident diagnosis turns the smoke alarm into the fire chief’s report.
The Hidden Cost of the Alert-Without-Context Problem
Most analytics teams have monitoring. Cloud Composer surfaces DAG failures. Cloud Monitoring fires threshold alerts. Slack notifications trigger automatically.
The monitoring layer is working fine.
The problem is everything that happens after it fires.
When a data pipeline alert fires, the typical response looks like this:
- Detection: An alert fires. The team is notified within minutes.
- Triage: An engineer opens logs, job history, and pipeline metadata. 20 to 40 minutes.
- Diagnosis: Root cause identified – quota exhaustion, schema drift, a late-arriving file. Another 15 to 30 minutes.
- Impact assessment: Downstream tables checked. Affected dashboards identified. Business teams notified. 20 to 30 minutes more.
- Resolution: Only now does the actual fix begin.
According to Monte Carlo’s State of Data Quality survey, data downtime nearly doubled year over year – driven by a 166% increase in time to resolution. 68% of data professionals report detection times of four hours or more. The investigation that follows the alert is where most of that time disappears.
The alert fires fast. The understanding comes slow.
That gap – between alert received and incident understood – is the actual problem.
Is your team spending more time diagnosing incidents than fixing them?
Tatvic helps GCP-first analytics teams compress incident response time with AI-powered diagnosis. Talk to an expert →
Why AI Incident Diagnosis Changes the Analytics Response Model
The SRE community has known for decades that incident response quality depends less on the speed of the alarm and more on the quality of information that follows it.
Google’s SRE incident management framework makes this explicit: automating root cause analysis and intelligent suggestion of mitigating actions frees engineers to focus on problem solving – not investigation.
Applied to data pipelines, this is precisely what AI incident diagnosis delivers.
An AI agent does not replace the engineer. It shows up to the incident having already done the first hour of work.
Here is what that looks like in practice:
What the Engineer Receives Today
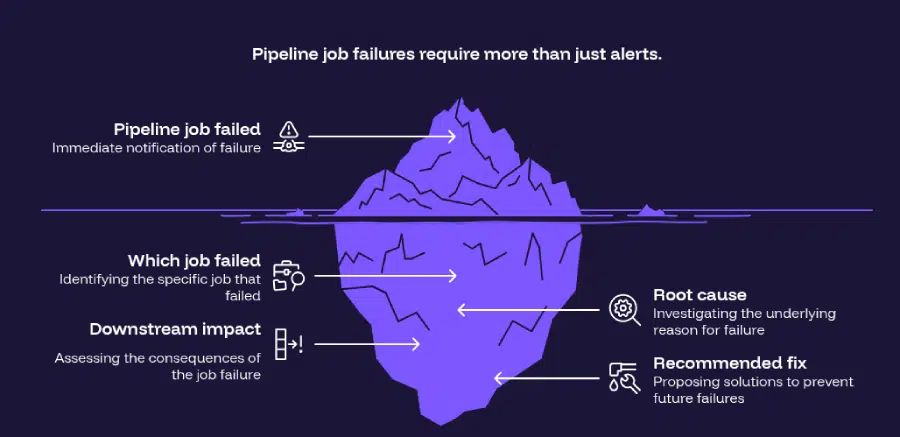
“Pipeline job failed.”
- No context on which task failed.
- No information on why it failed.
- No mapping of what broke downstream.
- No recommended next action.
The engineer opens three tools and starts reading logs. The investigation begins with no context.
What AI Incident Diagnosis Delivers Instead
“Concurrent query quota exceeded at 3:17 PM.
Weekend attribution rebuild triggered 11 simultaneous transformation jobs, exhausting the project’s concurrent query limit.
Five downstream reporting tables are affected – campaign_performance_daily, attribution_model_v2, and three Looker datasets reading from them.
The marketing performance dashboard will surface stale data. Automatic retry scheduled for 4:00 AM. No manual intervention required unless business reporting window cannot accommodate the delay.”
Same alarm. Same trigger.
Zero minutes spent on manual investigation.
The engineer reads a structured report and decides whether to act – not where to start looking.
The Four Layers of AI Incident Diagnosis
AI incident diagnosis is not a single capability. It operates across four layers – each addressing a different dimension of the investigation that currently consumes engineering time.
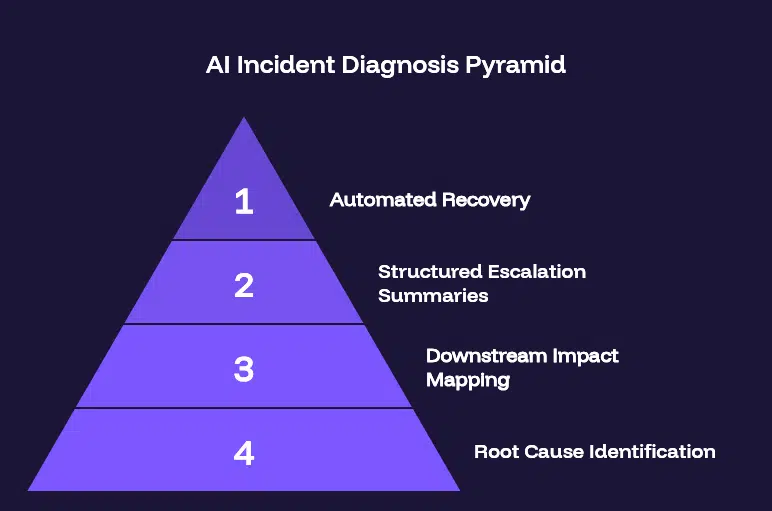
Layer 1: Root Cause Identification
The agent correlates signals across Cloud Logging error traces, BigQuery INFORMATION_SCHEMA job metadata, DAG execution history, and upstream dependency behavior.
When a failure occurs, it immediately determines:
- Was this quota exhaustion – and which job triggered the cascade?
- Was it a schema change upstream that broke a downstream transformation?
- Was it a missing file in GCS that caused a load job to fail?
- Is this transient – safe to auto-retry – or structural, requiring human intervention?
Each failure type has a different fix. The agent identifies which one applies – and surfaces it with a recommended action – before a human opens a single log.
Layer 2: Downstream Impact Mapping
One failed job cascades into stale reporting tables, broken Looker datasets, and wrong dashboard metrics.
The agent maps these dependencies automatically. The impact report shows:
- Which BigQuery tables ingested data from the failed job.
- Which Looker datasets are reading from affected tables.
- Which dashboards will surface wrong or stale data.
- Which business teams are likely to open those dashboards – and when.
The on-call engineer does not start from zero. They receive a complete impact picture – and can prioritize response based on business urgency, not just technical severity.
Layer 3: Structured Escalation Summaries
Most incident alerts go to engineers. The impact lands on business stakeholders.
The agent generates two summaries automatically:
- Technical summary: Root cause, affected tables, job history, retry status – for the engineering team.
- Business summary: Which dashboards are affected, which metrics are stale, when resolution is expected – for the analytics manager to share upward.
The analytics manager no longer has to translate a technical failure into a business update under pressure. That translation happens in seconds.
Layer 4: Automated Recovery
For recoverable failures – quota exhaustion, retry sequencing, temporary upstream delays – the agent acts without waiting.
- Failed jobs are queued for retry during off-peak windows.
- Parallel queries are staggered to prevent quota re-exhaustion.
- Data freshness is validated after recovery before reporting tables are promoted.
- A recovery summary is sent when the pipeline is healthy again.
For incidents that require human intervention, the agent escalates with a full diagnostic package – not a raw alert.
The engineer arrives at the incident already knowing what they are dealing with.
What AI Incident Diagnosis Does to MTTR
Mean time to resolution measures the time from incident detection to full recovery. Most analytics teams track detection time and fix time. Almost none track the investigation time in between.
But investigation time is where most MTTR lives – the time spent understanding what failed before the fix can begin.
According to DORA’s 2024 State of DevOps Report, elite engineering teams maintain MTTR below 60 minutes, while low performers average over 24 hours. The gap is not how fast they fix things. It is how fast they understand what needs fixing.
AI incident diagnosis attacks MTTR at its largest component: the investigation window.
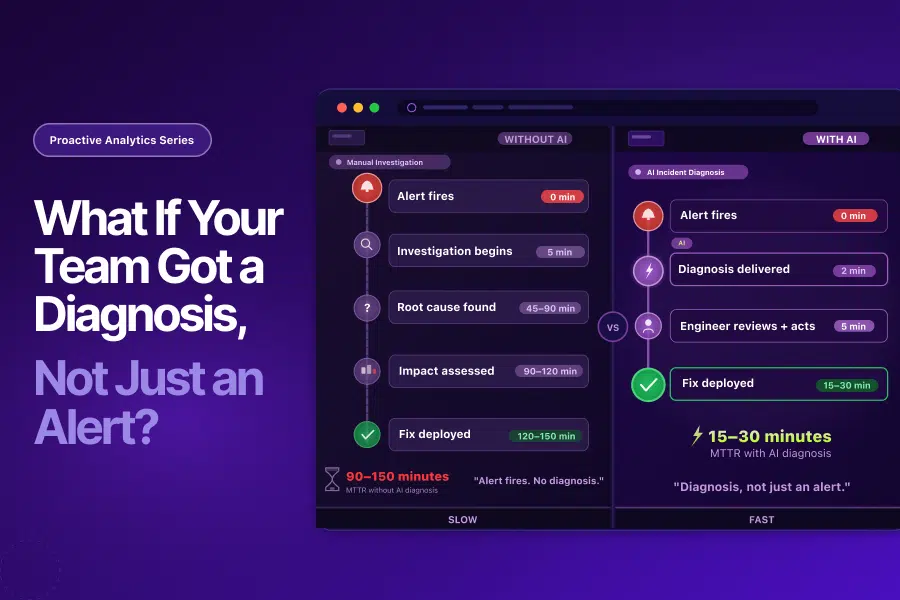
Without AI incident diagnosis:
- Alert fires → investigation begins → root cause identified: 35 to 90 minutes.
- Impact assessed → fix deployed: 60 to 150 minutes total.
With AI incident diagnosis:
- Alert fires → diagnosis delivered automatically: 2 minutes.
- Engineer reviews structured report → fix deployed or recovery confirmed: 10 to 30 minutes total.
The fix itself takes the same amount of time. The investigation window compresses from 60 to 90 minutes to near zero.
That compression is where AI incident diagnosis delivers its primary value.
How Tatvic Solves This in Real Analytics Environments
At Tatvic, we work with organizations where data pipeline incidents have direct business consequences – GA4 exports into BigQuery powering attribution models, Looker dashboards driving media decisions, performance reporting that leadership reads daily.
In these environments, the cost of a slow incident response is not just engineering hours:
- A marketing team making spend decisions on stale attribution data.
- An analytics manager on a call with leadership explaining why numbers changed overnight.
- An executive presentation built on metrics that were wrong for 90 minutes before anyone knew.
In one Tatvic client environment, a pipeline incident during a high-spend media period went undetected for 47 minutes after the alert fired – because the alert email was buried. By the time investigation began, the media team had already made three budget reallocation decisions on stale conversion data. The pipeline failure lasted two hours. The downstream decisions had already been made.
Most GCP analytics teams Tatvic works with already have:
- Cloud Composer for pipeline orchestration and DAG-level failure events.
- Cloud Monitoring for metric threshold alerts.
- Cloud Logging for error traces and execution history.
The alerting infrastructure is in place.
What is missing is the intelligence layer that interprets those alerts.
Tatvic’s Agentic AI monitoring layer adds exactly this. It sits above Cloud Composer and Cloud Monitoring – reading their signals together, correlating them, and producing a structured incident diagnosis at the moment the alert fires.
When a pipeline incident occurs, the system:
- Identifies root cause automatically – quota exhaustion, schema drift, orchestration failure, or upstream data issue.
- Maps downstream impact – which tables are stale, which dashboards are affected, which teams are at risk.
- Generates a structured summary for both the engineering team and the analytics manager.
- Executes automated recovery where possible and escalates with full diagnostic context where it cannot.
Rohan would not have spent 40 minutes on the Thursday alert.
He would have opened a structured report, confirmed the recommended recovery, and closed his laptop in under 10 minutes.
The alarm would have been the same. The response would have been unrecognizable.
AI Incident Diagnosis Is the Next Evolution in Data Ops
The analytics operations community has gone through two major reliability evolutions in the last decade.
- Evolution 1 – Monitoring: Teams went from no visibility to alert coverage. Cloud Composer, Cloud Monitoring, and observability tools solved detection. Teams started knowing when things broke.
- Evolution 2 – Data Observability: Teams went beyond infrastructure to data content. dbt tests, Great Expectations, and Dataplex solved validation. Teams started knowing when the data itself was wrong.
- Evolution 3 is AI incident diagnosis.
The next improvement is not more alerts or more validation rules. It is intelligence that sits between detection and response – that takes the signal and produces the understanding before a human has to investigate.
Teams that adopt AI incident diagnosis shift from reactive to informed:
- From: “Alarm received. Investigation begins. Root cause found in 60 minutes. Fix deployed.”
- To: “Alarm received. Report delivered. Engineer reviews and acts. Fixed in 15 minutes.”
That shift is the difference between a team that burns senior engineer capacity on forensic investigation and one that redirects that capacity toward work that actually moves the business forward.
Key Takeaways
- The alert is not the bottleneck. The investigation is. Most analytics teams spend 30 to 90 minutes diagnosing what failed before fixing anything – the alert fires fast, but understanding what it means comes slow.
- Today’s alerts are like smoke alarms – they tell you something is wrong, but not which room is burning, what caused it, who is inside, or whether the fire already spread. AI incident diagnosis turns that smoke alarm into the fire chief’s report.
- According to Monte Carlo’s State of Data Quality survey, data downtime nearly doubled year over year, driven by a 166% increase in time to resolution. The investigation window is where most of that time lives.
- AI incident diagnosis compresses the investigation window – delivering root cause, downstream impact, and recommended fix at the moment the alert fires. The fix takes the same time. The understanding becomes near-instant.
- According to DORA’s 2024 research, elite engineering teams maintain MTTR below 60 minutes. The gap versus low performers is not fix speed – it is understanding speed. AI incident diagnosis closes that gap.
Is Your Team Spending More Time Investigating Than Fixing?
If your engineers are opening logs and job histories every time an alert fires – spending the first hour of every incident figuring out what went wrong – the issue is not the alert. It is the absence of AI incident diagnosis.
Tatvic helps GCP-first analytics teams implement Agentic AI monitoring that delivers a structured incident diagnosis at the moment an alert fires – so engineers arrive at every incident already knowing the root cause, the downstream impact, and the recommended fix.
See what an AI-generated incident report would look like for your environment →

