Is your website stuck in a conversion rut? Are you unsure which design elements resonate with your users? A/B testing can help you discover the right answer.
This guide empowers you to run statistically sound tests, interpret results with clarity, and finally optimize for success.
How to do AB testing?
A/B testing can be broken down into three key processes:
-
Deciding What to Test:
This stage involves identifying areas of your website, app or landing page that could benefit from improvement and formulating a hypothesis for how changes might impact user behaviour.
-
Conducting Statistically Significant Tests:
Here, you’ll ensure your test is designed and run in a way that produces reliable results.
-
Interpreting the Test Results:
This involves analyzing the data, drawing conclusions, and determining if the findings are actionable.
What are the elements to consider while doing an A/B Test?
As a conversion rate optimization (CRO) expert, here’s how I would decide what elements to A/B test across the publishing, eCommerce, and B2C industries:
1. Understanding User Intent and the Customer Journey:
-
Research & Analyze User Behavior:
Conduct user research (surveys, user testing) to understand user goals, pain points, and frustrations across different stages of the funnel (awareness, consideration, decision, purchase). Heatmaps and session recordings can also be valuable tools to see how users interact with your website or app.
-
Map the Customer Journey:
For each industry (publishing, eCommerce, B2C), create a customer journey map outlining the touchpoints users go through, from initial awareness to conversion. This will help identify potential bottlenecks and opportunities for optimization.
Check out the below industry-wise pointers to enhance conversion rate:
a) Publishing
-
-
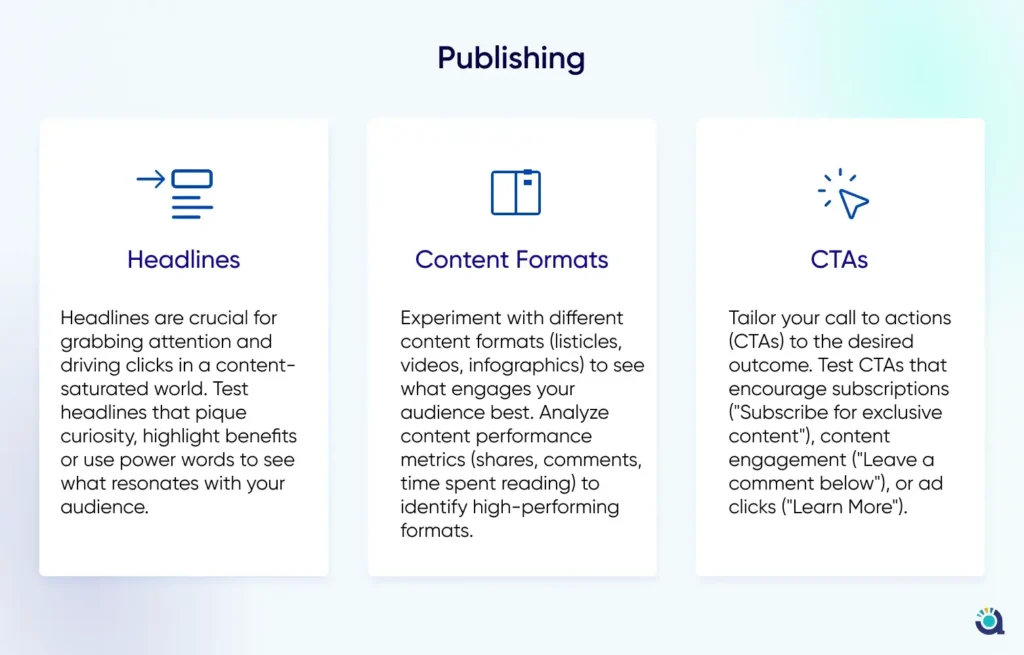
Headlines:
Headlines are crucial for grabbing attention and driving clicks in a content-saturated world. Test headlines that pique curiosity, highlight benefits, or use powerful words to see what resonates with your audience.
-
Content Formats:
Experiment with different content formats (listicles, videos, infographics) to see what engages your audience best. Analyze content performance metrics (shares, comments, time spent reading) to identify high-performing formats.
-
CTAs:
Tailor your call to action (CTA) to the desired outcome. Test CTAs that encourage subscriptions (“Subscribe for exclusive content”), content engagement (“Leave a comment below”), or ad clicks (“Learn More”).
-
-
-
-
-
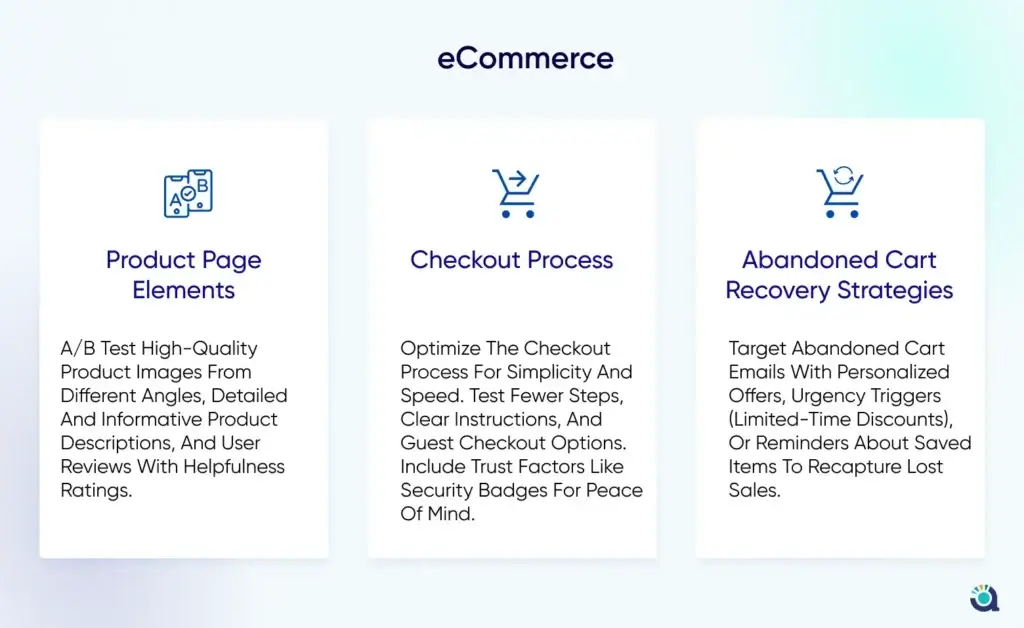
Abandoned Cart Recovery Strategies:
Target abandoned cart emails with personalized offers, urgency triggers (limited-time discounts), or reminders about saved items to recapture lost sales.
-
-
-
c) B2C:
-
-
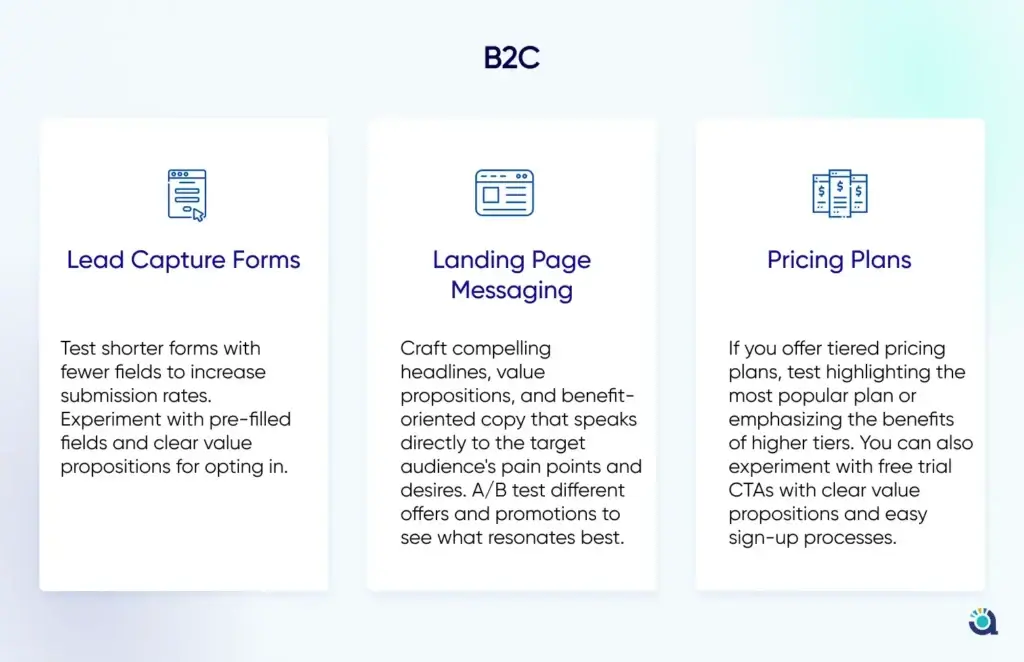
Lead Capture Forms:
Test shorter forms with fewer fields to increase submission rates. Experiment with pre-filled fields and clear value propositions for opting in.
-
-
-
-
-
Landing Page Messaging:
Craft compelling headlines, value propositions, and benefit-oriented copy that speaks directly to the target audience’s pain points and desires. A/B test different offers and promotions to see what resonates best.
-
-
-
-
-
Pricing Plans:
If you offer tiered pricing plans, test highlighting the most popular plan or emphasizing the benefits of higher tiers. You can also experiment with free trial CTAs with clear value propositions and easy sign-up processes.
-
-
-
D) Remember:
-
-
Industry Best Practices:
Research common A/B testing practices within your specific industry for additional ideas.
-
-
-
-
-
Align with Business Goals:
Always prioritize tests that align with your overarching business goals, whether it’s increasing subscriptions (publishing), boosting sales (eCommerce), or generating more leads (B2C).
-
-
By focusing on these industry-specific elements and tailoring your A/B tests to your unique goals, you can maximize your chances of achieving significant conversion rate improvements.
2. Focus on High-Impact Elements:
-
Headlines & CTAs:
Clear, concise, and benefit-oriented headlines and CTAs can significantly impact click-through rates and conversion rates. Test different variations to see what resonates most with your audience.
-
Value Propositions:
Craft compelling messaging that communicates the benefits your product or service offers. Test different messaging variations to find what resonates best.
-
Visuals:
High-quality images, videos, and infographics can significantly improve engagement and conversions. Test different types of visuals and placements to see what works best.
3. Prioritize Based on Data & Analytics:
-
Identify Low-Hanging Fruit:
Analyze website analytics to identify areas with high traffic but low conversion rates. These areas are prime candidates for A/B testing.
-
Leverage Heatmaps & Session Recordings:
See how users interact with your website or app. Look for areas of confusion or frustration and prioritize tests to address those issues.
4. Continuously Test and Iterate:
-
A/B Testing is an Ongoing Process:
Don’t stop testing after one experiment. Develop a testing roadmap and continually test new hypotheses to improve conversion rates.
-
Data-Driven Decisions:
Always base your decisions on data from your A/B tests.
By following these steps, you can identify the most impactful elements to A/B test across publishing, eCommerce, and B2C industries, and achieve significant improvements in your conversion rates.
A/B Testing Process and Framework to Follow:
-
-
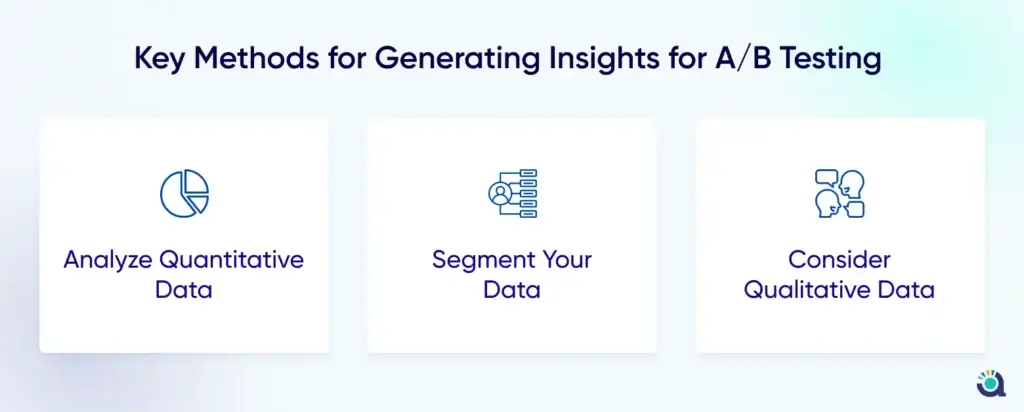
Generating Insights for AB Testing
Generating insights from A/B testing involves analyzing the data collected during the test and understanding what it tells you about user behaviour. Here are some key methods:

-
Analyze Quantitative Data:
-
Metrics
Look at the impact of your variations on the primary metric (e.g., conversion rate, sign-ups) and secondary metrics (e.g., time spent on page, bounce rate). A/B testing tools will provide this data.
-
Statistical Significance
Don’t assume a small improvement automatically means the variation is better. Use statistical tests to determine if the observed difference is statistically significant, meaning it’s likely not due to random chance.
-
-
Segment Your Data:
-
Audience Breakdown
Don’t just look at the overall results. Segment your data by demographics, user behavior, or other relevant factors. This can reveal variations that work better for specific user groups.
-
-
Consider Qualitative Data:
-
User Feedback:
While A/B testing focuses on quantitative data, don’t ignore user feedback. Conduct surveys or user interviews to understand why users might be responding to variations in a particular way. This can help you refine your hypotheses for future tests.
-
-
How to Create a Data-driven Hypothesis?
How do you ideally create a data-driven hypothesis?
-
Step1: Start with a clear question:
Before diving into data, define the specific user behavior or outcome you want to understand. What problem are you trying to solve, or what user experience are you trying to improve? A clear question keeps your hypothesis focused and relevant.
-
Step2: Gather and explore your data:
Look at relevant website analytics, user behavior data, and any customer feedback you have. This could include metrics like conversion rates, bounce rates, time spent on specific pages, or click-through rates on buttons. Tools like heatmaps and session recordings can also provide valuable insights into user behavior.
-
Step3: Identify trends and patterns:
As you explore the data, look for trends, correlations, or areas where user behavior seems unexpected. For instance, are users abandoning carts at a specific step in the checkout process? Is a particular call to action (CTA) underperforming?
-
Step4: Formulate a hypothesis based on data and observation:
As you explore the data, look for trends, correlations, or areas where user behavior seems unexpected. For instance, are users abandoning carts at a specific step in the checkout process? Is a particular call to action (CTA) underperforming?
Here’s the format: “If we [change X], then [desired outcome Y] will happen because of [reasoning based on data].”
- X represents the specific element, design feature, or user experience you’ll modify in the A/B test.
- Y represents the desired outcome you expect to see as a result of the change (e.g., increase in sign-ups, decrease in bounce rate).
- Reasoning explains why you expect the change to lead to the desired outcome. This justification should be based on the insights you gleaned from the data exploration.
-
Some of the Examples of data-driven hypotheses:
- Original: “We should change the button color to red because it’s a more eye-catching color.” (Lacks data backing)
- Data-driven: “If we change the button color from blue to orange (which has a higher conversion rate on similar CTAs on our site), then click-through rate will increase by 5% because orange stands out better on our current background color scheme.”
-
Tips for strong data-driven hypotheses:
- Be Specific: Clearly define the change you’ll be testing and the expected outcome.
- Quantifiable: Whenever possible, express your desired outcome in measurable terms (e.g., increase conversion rate by 10%).
- Actionable: The hypothesis should guide the creation of variations for your A/B test.
- Falsifiable: A good hypothesis allows you to disprove it with the test results, leading to new learnings.
-
How to track A/B Testing Results?
Once you’ve designed and implemented your A/B test, tracking the results is crucial to understand its effectiveness. Here’s what you need to know:
![]()
-
-
-
Analytics Tools:
Most A/B testing tools provide built-in analytics dashboards that track key metrics for each variation. These metrics should align with your success criteria defined earlier (e.g., conversion rate, click-through rate, bounce rate).
-
Tracking Code:
You might need to implement a tracking code on your website or app to monitor specific user actions or events related to the variations being tested.
-
Data Visualization:
Utilize charts and graphs to visualize the performance of each variation over time. This can help you identify trends and make comparisons more easily.
-
Statistical Significance:
Don’t rely solely on face-value improvements. Use statistical tests provided by your A/B testing tool or third-party analytics platforms to determine if the observed difference between the control and variation is statistically significant. This ensures the results are likely due to your changes and not random chance.
-
-
Conclusion:
A/B testing is not just about making changes randomly; it’s a strategic process aimed at understanding user behavior, optimizing user experiences, and ultimately driving meaningful results for your business.
