
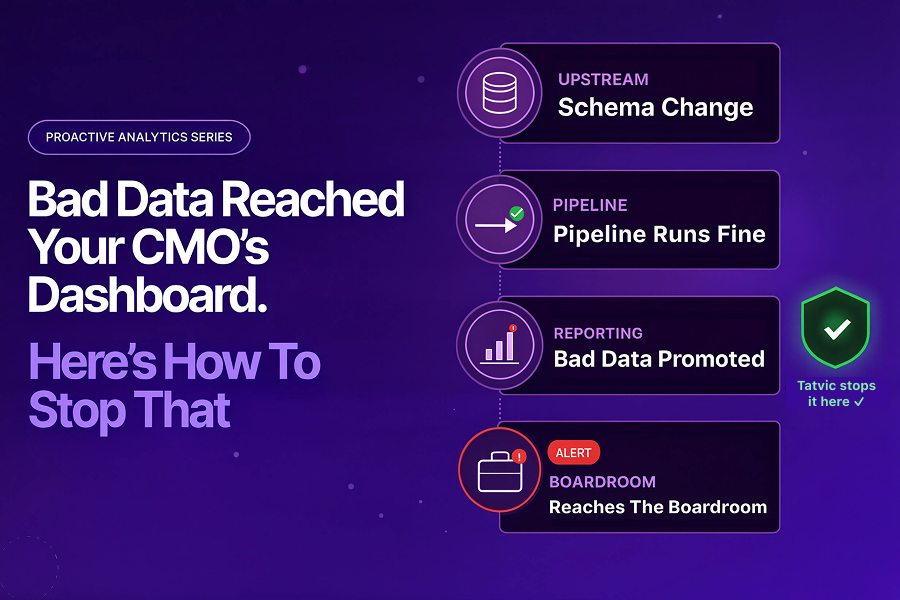
Bad Data Reached Your CMO’s Dashboard. Here’s How to Stop That.
The pipeline had recovered. Engineering considered the incident closed. Slack went quiet.
But the real problem had just started.
Three days later, Priya’s CMO was presenting quarterly marketing performance to the board. Conversion rates looked unusually high. Customer acquisition costs appeared to have dropped significantly.
The CMO made a confident case for scaling media spend in two underperforming regions.
A week after that, someone noticed the numbers were wrong.
The attribution model had been pulling from a stale reporting table. It had stopped updating during the pipeline failure three days earlier. Nobody had validated whether the data was correct after the pipeline recovered.
The pipeline had been fixed. But bad data had already reached the dashboard. And from the dashboard, it had reached the boardroom.
According to Harvard Business Review, bad data costs businesses $3.1 trillion annually. The damage is rarely from a single catastrophic failure – it comes from corrupted data that travels silently through pipelines and surfaces in decisions made with total confidence.
This is the second problem most analytics teams do not solve.
Post 1 of this series covered BigQuery pipeline failures – jobs that break, quotas exhausted, data that never arrives. Read: Your Data Pipeline Breaks Every Monday. It Doesn’t Have To →
This post covers something more dangerous: data that does arrive – but arrives wrong.
Bad data in dashboards is not a pipeline problem. It is a data quality monitoring problem.
And the gap between the two is where reporting trust quietly breaks.
Why Data Quality Monitoring Is Not the Same as Pipeline Monitoring
Bad data in dashboards rarely announces itself.
A pipeline failure is visible – dashboards go blank, engineers get paged, someone notices immediately.
Bad data is the opposite. Dashboards look normal when bad data arrives.
Numbers populate, charts render, colors are right. The only problem is that what the dashboard shows is wrong – and nobody in the room knows it.
Most analytics teams treat data quality monitoring and pipeline monitoring as the same thing. They are not.
- Pipeline monitoring checks whether a job ran – it is an infrastructure health check.
- Data quality monitoring checks whether what it produced is actually correct – it is a content and dashboard data accuracy check.
Most teams do the first. Very few do the second consistently.
That gap is where bad data enters the dashboard.
According to Monte Carlo’s State of Data Quality report, stakeholders – not data teams – are the first to discover data quality issues in the majority of cases. The analytics team finds out when someone in a meeting says the numbers look wrong.
By the time a stakeholder notices bad data in a dashboard, the damage has usually already happened:
- A campaign decision was made on wrong attribution data.
- Campaign budgets get allocated based on inflated conversion numbers.
- Regional performance reports give leadership a false picture.
- Trust in the analytics team – quietly, permanently – took a hit.
More monitoring is not the fix. Validation that runs before data is promoted to dashboards is.
Wondering if silent data quality issues are already affecting your reporting layer?
Tatvic helps GCP-first teams identify hidden validation gaps before they impact decisions. Talk to an expert →
What Tatvic Sees Across Data Validation Environments
At Tatvic, we work with organizations where GA4 data flows continuously into BigQuery and surfaces in Looker dashboards that leadership reads every week.
Pattern: Data quality monitoring tools exist. Continuous data observability does not. Most teams run dbt tests or periodic QA – checks that catch what they anticipated, not what they didn’t.
Example: A GA4 event stops firing after a frontend deploy. A schema change breaks a downstream JOIN silently. A null spike skews aggregations without triggering an alert.
Consequence: None of these break the pipeline. All of them produce bad data in dashboards – and all of them are preventable with the right validation layer.
Wondering if bad data is already slipping into your dashboards unnoticed?
Assess your current validation gaps →
The Silent Spread of Bad Data
Understanding how bad data reaches a dashboard makes the solution clearer. The journey typically looks like this:
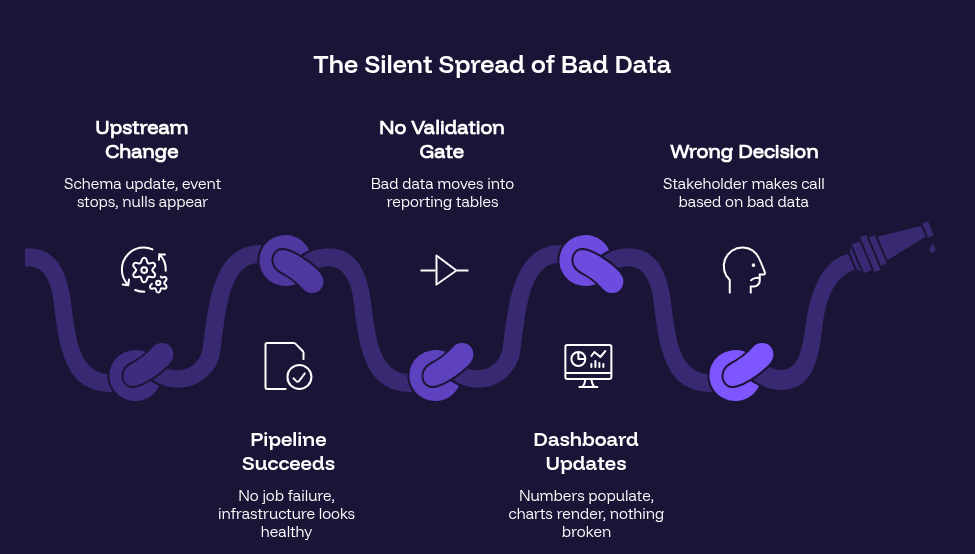
IBM’s 2025 Institute for Business Value report found that over a quarter of organizations lose more than $5 million annually due to poor data quality. The cost is not the bad data itself – it is the decisions made on it.
The Three Most Common Data Quality Issues in BigQuery Dashboards
Not all wrong dashboard data looks the same. Across GA4 → BigQuery → Looker ecosystems, three data quality issues account for the majority of failures that reach dashboards – and all three bypass standard data quality monitoring:
1. Schema Drift
A column gets renamed. A data type changes. A new field is added upstream that breaks a downstream JOIN.
Schema drift is particularly dangerous because it is invisible to standard monitoring. The pipeline runs. The table refreshes. But the transformation logic no longer matches the schema it was built for.
Dashboards built on top of that transformation start serving wrong aggregations – and they look completely normal doing it.
2. Null Spikes and Volume Anomalies
A GA4 event stops firing after a code push. A tracking tag gets removed by mistake. A data source experiences a partial outage.
The result is a sudden spike in null values, or a row count that drops unexpectedly. Both skew dashboards in ways that can mislead decision-making – especially when the drop is gradual enough not to trigger threshold alerts.
Volume anomalies are one of the hardest bad data patterns to catch manually, because they require comparison against historical baselines – not just a check against current state.
3. Silent Transformation Errors
A data type mismatch causes a numeric field to round incorrectly. A filter in a transformation excludes records it should not. A CASE statement logic has an edge case that was never tested.
These errors produce data that is structurally correct but semantically wrong. Everything looks fine. The numbers are just slightly off – or, in some cases, significantly off in ways that only become visible at scale.
These are the errors that reach CMO dashboards.
Data Quality Monitoring Tools: What They Do and Where They Fall Short
The analytics ecosystem has mature data validation tools for data quality monitoring. Understanding what they do – and what they miss – is an important context for where data observability and AI agents add value.
1. dbt Tests
dbt helps teams validate assumptions inside transformation layers:
- Null checks
- Uniqueness validation
- Accepted values
- Referential integrity
The limitation?
dbt catches expected failures. It does not detect anomalies nobody explicitly wrote tests for.
A gradual 18% drop in conversion events may pass silently if no threshold exists.
2. Great Expectations
Great Expectations expands validation through richer statistical checks and expectation frameworks.
It is powerful for structured testing. But like dbt, it still depends on one thing: Human anticipation.
If teams did not define the rule, the anomaly often goes unnoticed.
3. Google Dataplex
Dataplex provides native rule-based validation inside BigQuery:
- Null checks
- Range validations
- Custom SQL assertions
- Profiling for distributions and completeness
For GCP-first teams, it is often the most practical governance foundation. But Dataplex still operates on predefined logic. And data quality issues rarely stay inside predefined boundaries.
That is where continuous observability and AI-led anomaly detection become critical.
The 1-10-100 rule in data quality states: it costs $1 to verify data at the source, $10 to fix it downstream, and $100 to fix decisions made on bad data. HBR notes it costs ten times as much to complete a unit of work when data is flawed as when it is perfect.
What an AI Agent Adds to Data Quality Monitoring
An AI agent does not replace dbt tests, Great Expectations, or Dataplex. These data validation tools are the foundation of any solid data quality monitoring stack.
The agent adds the data observability layer on top of them. Here is what that means across four specific capabilities:
1. Anomaly Detection Beyond Rules
Rule-based validation catches what you defined. An AI agent detects what deviates from normal – even if no rule was written for it.
By learning historical baselines for each table – typical row counts, null rates, value distributions, column statistics – the agent flags deviations that are statistically significant, even when they do not cross a hard threshold.
- A 12% drop in conversion events after a frontend deploy.
- A null rate in the campaign_id column that increased from 2% to 18% overnight.
These are detectable without a pre-written rule – because the agent knows what normal looks like.
2. Pre-Promotion Validation Gates
The most effective place to stop bad data is before it reaches the dashboard – at the promotion step, when data moves from raw or transformed tables into reporting layers.
An AI agent sitting at this gate runs a validation check before each promotion:
- Does this batch match historical baselines within expected variance?
- Are there new nulls in columns that should never be null?
- Has the row count changed in a way that cannot be explained by normal volume trends?
- Did a schema change occur upstream that may have affected this transformation?
If validation fails, the promotion is blocked. The reporting table is not updated. The dashboard continues to show the last known good data – clearly marked as stale – rather than surfacing corrupted numbers.
The CMO sees a freshness warning. Not wrong numbers.
3. Root Cause Tracing
When a data quality issue is detected, the agent does not just flag it. It traces the issue upstream.
Correlating Dataplex scan results, dbt test outputs, BigQuery INFORMATION_SCHEMA metadata, and upstream event data, the agent identifies where in the pipeline the issue originated:
- A GA4 event that stopped firing at 11:43 PM.
- A schema change in an upstream source table at 8:15 PM.
- A transformation query that produced unexpected nulls due to a JOIN condition.
The data team receives a diagnosis – not a validation failure report. They know what broke, where it broke, and what it affected downstream.
4. Downstream Impact Mapping
Bad data in a single BigQuery table rarely stays in that table. It propagates downstream – into joined tables, aggregated datasets, Looker explores, and dashboard tiles.
The agent maps this propagation automatically. When a data quality issue is detected, the impact report shows:
- Which downstream tables ingested the bad data.
- Which Looker dashboards are reading from affected tables.
- Which business teams are looking at potentially corrupted metrics.
- Which decisions may have already been made on bad data.
That last point is the hardest one. The agent cannot undo decisions. But it can surface the exposure – so teams can quantify the impact and, if necessary, correct course before the damage compounds.
How Tatvic Solves This in Real Environments
Common Failure Patterns We See
Across GA4 → BigQuery implementations, bad data in dashboards rarely traces back to a single failure. It traces back to a gap in the validation architecture – a point where data was trusted without being verified.
The most common gap is at the promotion boundary: where transformed data moves into reporting tables that feed Looker dashboards. Most teams have validation before this point – dbt tests in their transformation layer, some Dataplex rules on key tables. Very few have a validation gate at the promotion step itself.
The three patterns we see most frequently:
- Schema drift – upstream column renames break downstream transformations silently
- Stale tables – pipeline recovers but the reporting layer is never revalidated
- Event changes – a GA4 parameter rename causes key metrics to underreport for days
Example From a Client Environment
In one Tatvic client environment, a GA4 custom event parameter was renamed during a site redesign. The parameter name change was not reflected in the BigQuery transformation. For 11 days, a key conversion metric was underreported by 34%. The issue was discovered when a campaign being considered for budget reduction was found to have actually been the top performer – once the data was corrected.
Eleven days of wrong data. One campaign almost cut. Zero pipeline failures during that entire period.
The pipeline worked perfectly. The validation layer did not exist.
Implementation Approach
Tatvic helps organizations build a validation layer that sits between their BigQuery pipelines and their Looker reporting environment – combining:
- Dataplex – rule-based governance on key BigQuery tables
- dbt – transformation-layer testing for expected data assumptions
- AI validation layer – anomaly detection at the promotion gate, catching what rules miss
The result is a reporting environment where:
- Bad data is caught before it reaches dashboards – not discovered in a board meeting
- Data quality issues are diagnosed with root cause context – not just flagged as failures
- Business teams receive a freshness warning when data is stale – not wrong numbers
- Downstream impact is mapped automatically – so teams know what was affected and by how much
Priya’s attribution problem would have looked different. The GA4 event parameter change would have been detected at the validation gate during the next promotion cycle. The CMO’s dashboard would have shown a freshness warning – not three days of incorrect conversion data.
The board presentation would have been postponed. Not corrected a week later.
Is Bad Data Reaching Your Dashboards Before You Notice?
If your team discovers data quality issues from stakeholder complaints or wrong numbers in meetings, there is likely a validation gap between your pipeline and your reporting layer.
Tatvic helps GCP-first analytics teams build continuous validation layers across their BigQuery ecosystems – detecting bad data before it reaches dashboards, diagnosing root causes with full pipeline context, and blocking bad data promotions before they affect business decisions.
Most teams don’t know where bad data enters their reporting layer – until leadership questions the numbers. Assess your validation gaps →

