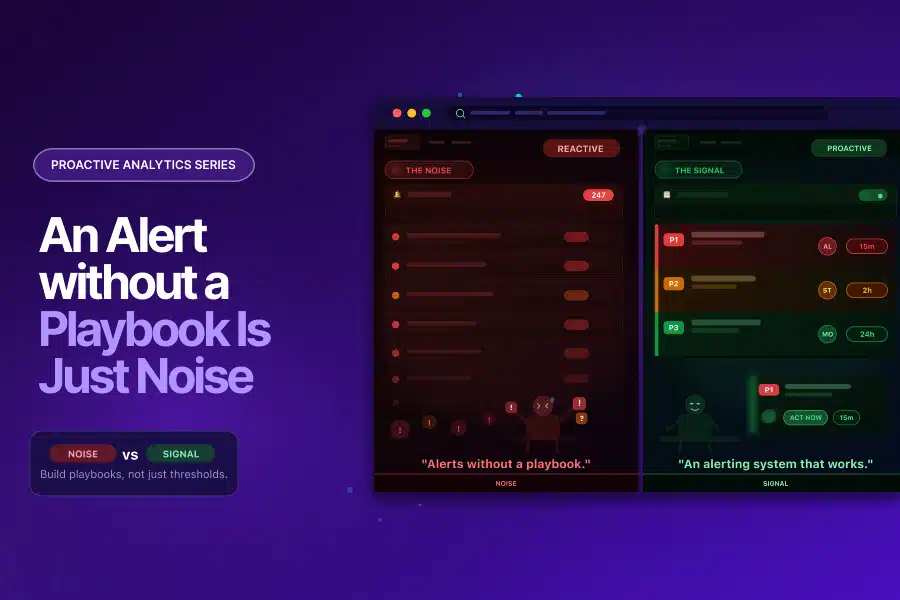
An Alert Without a Playbook Is Just Noise: Building an Analytics Alerting System That Works
In this Proactive Analytics series, we have covered the foundation (Proactive Analytics), the detection layer (Anomaly Detection in GA4), and a high-stakes use case. All three end at the same place. Something is detected. An alert fires. And then what?
For most analytics teams, the honest answer is: not much. The alert lands in an inbox. Someone glances at it. It gets marked as read without action. Or it does not get read at all.
This is not a technology problem. It is a design problem. And it is the most common reason proactive analytics setups fail to deliver their full value.
The Alert Fatigue Problem Is Real, and It Is Not Limited to IT
Alert fatigue is widely documented across operations teams. Splunk’s State of Observability 2025 report, surveying 1,855 ITOps and engineering professionals, found that 73% of organizations experienced outages directly linked to ignored or suppressed alerts. The same research found that 59% say they have too many alerts, and 55% deal with too many false positives. The AI SOC Market Landscape 2025 report by SACR found that 40% of alerts are never investigated, and 61% of teams admitted to ignoring alerts that later proved critical.
These figures come from security and operations contexts. But the dynamic is identical in analytics:
- A GA4 custom insight fires daily because the threshold is set too low
- An anomaly alert triggers during a known promotional period because baselines have not been calibrated
- A data quality alert lands in a shared inbox with no named owner and no expected action
- A team that has been burned by false positives stops treating alerts as actionable signals
The result is an analytics alerting system that runs in the background, generates notifications, and influences nothing. The monitoring is in place. The detection is working. The value is lost at the last step.
Why Analytics Alerts Get Ignored
Understanding why alerts fail is the first step toward designing a system that works. The reasons are consistent across analytics teams:
No Context in the Alert Itself
An alert that says “sessions dropped by 23%” gives you a number. It does not tell you which pages, which segments, which device types, which time period, or what the likely cause is. Without context, the recipient cannot assess severity or take action without conducting their own investigation first. Most do not. They dismiss the alert and move on.
No Severity Tiering
When every alert looks the same, a revenue-impacting conversion failure competes for attention with a minor informational fluctuation. Teams learn quickly that most alerts are low severity. They apply that assumption to all of them. The critical ones get caught in the same net as the noise.
No Named Owner
An alert sent to a team, a shared inbox, or a distribution list has no clear owner. Everyone assumes someone else will handle it. This is not a behavioural failure; it is a structural one. Alerts without owners get resolved at the speed of the slowest person who reads them, which is usually never.
No Defined Response Expectation
Even when an alert reaches the right person, if there is no defined response protocol, the recipient has to decide in the moment what to do, when to do it, and who to involve. That decision overhead is often enough to push the response to “later,” which becomes never.
Static Thresholds Generating Predictable Noise
As covered in the Anomaly Detection in GA4 blog, static sensitivity settings produce alerts during expected peaks, known seasonal patterns, and normal day-of-week variation. When a team receives enough of these, they stop trusting the system. A well-calibrated analytics alerting system is the foundation of alert trust. Without trust, the system is decorative.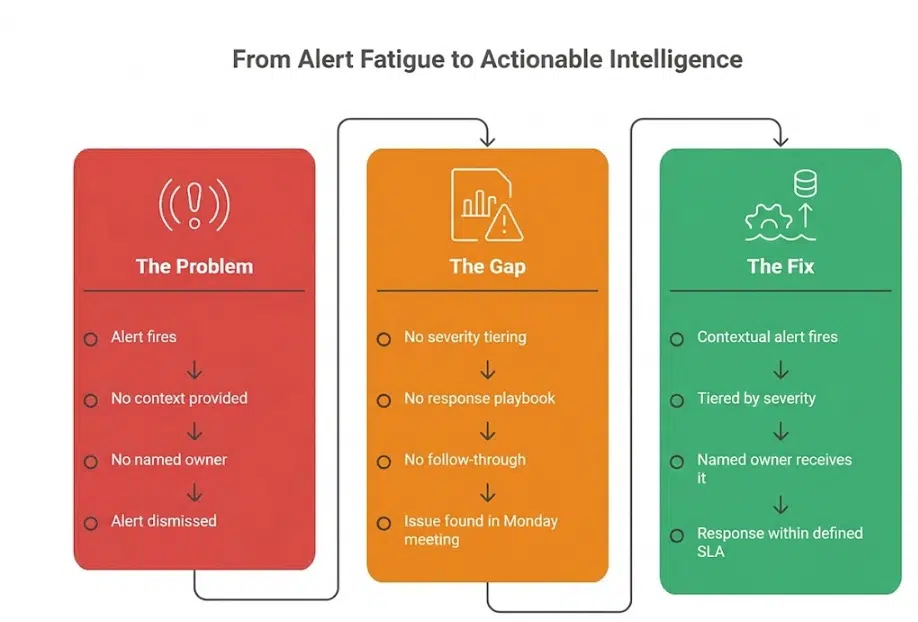
Already experiencing alert fatigue in your analytics setup? Tatvic’s team can help you audit your current alerts and identify what to keep, recalibrate, and remove. Get in touch.
What a Working Analytics Alerting System Actually Looks Like
An effective analytics alerting system is not defined by how many alerts it generates. It is defined by how many alerts drive action. The design principles that separate the two are straightforward.
Alerts Carry Context, Not Just Numbers
Every alert in a working analytics alerting system answers four questions immediately:
- What changed: the specific metric, event, or parameter affected
- By how much: the magnitude of the deviation and the expected range
- Since when: the precise time the anomaly began
- Which segment: the dimension combination where the deviation is isolated (browser, region, device, channel)
This context is what turns a notification into a brief. The recipient knows what they are looking at before they open the dashboard. Response time drops significantly when the investigation has already been done by the system.
Severity Is Tiered by Business Impact, Not Metric Size
A working analytics alerting system does not treat all anomalies equally. It routes alerts based on their proximity to revenue and decision-making:
- A conversion tracking failure is a P1. It affects the accuracy of every marketing decision made from that point forward.
- A parameter-level data quality issue is a P2. It affects reporting accuracy but not necessarily in real time.
- An informational anomaly with no immediate business impact is a P3. It is worth knowing about, but it does not need to interrupt anyone’s day.
Tiering prevents the critical from being buried by the routine. It also gives recipients a rational basis for prioritisation rather than asking them to judge severity from a raw notification.
Every Alert Has a Named Owner and a Defined SLA
High-performing analytics alerting systems remove ambiguity before alerts even fire. Teams define ownership in advance, mapping every alert type to a named role or individual with a clear response time expectation.
- P1 alerts: analytics lead responds within one hour, marketing director informed within two
- P2 alerts: analytics team responds within 24 hours
- P3 alerts: reviewed in the next weekly analytics meeting
This structure removes decision overhead from the recipient. They know what they are expected to do and by when.
How to Build an Analytics Alerting System That Drives Action
Building an analytics alerting system that works is a four-step process. Each step addresses one of the failure points described above.
Step 1: Audit your existing alerts and remove the noise.
Start by listing every alert currently active in your GA4 setup, your anomaly detection configuration, and any third-party monitoring you have in place. For each one, ask: has this alert driven a response in the last 60 days? If not, it is noise. Disable it or recalibrate it before adding anything new. A smaller set of high-trust alerts is more valuable than a comprehensive set of ignored ones.
Step 2: Build a tiered alert hierarchy.
Map your alerts to three priority levels based on business impact:
- P1: Revenue impact, conversion tracking failure, data collection break
- P2: Data quality issue affecting reporting accuracy, parameter-level anomaly, attribution signal change
- P3: Informational anomaly, dimension-level shift, informational trend change
Assign each tier a response SLA and a named owner. The tier system only works if the definitions are agreed upon by the team before an alert fires, not negotiated in the moment.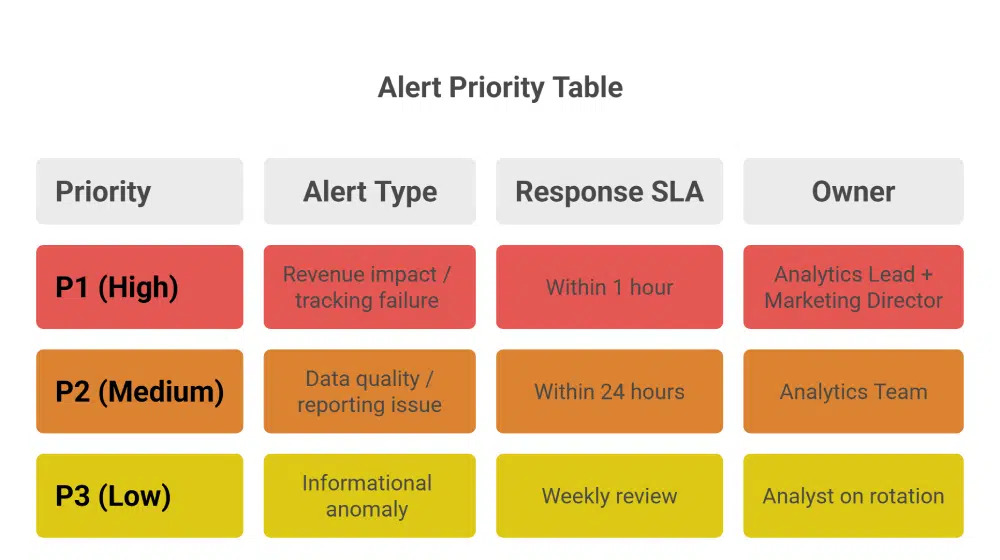
Step 3: Add context to every alert.
Work with your anomaly detection and monitoring setup to ensure every alert includes: what changed, by how much, since when, and in which segment. This may require configuring alert templates in your monitoring solution or using Tatvic’s anomaly detection solution, which surfaces this context automatically. Without it, your alerts will generate activity but not resolution.
Step 4: Build and distribute a response playbook.
For each alert type, document:
- The first action the owner is expected to take
- The diagnostic questions to answer within the first 30 minutes
- The escalation path if the issue cannot be resolved at the owner level
- The communication template for notifying stakeholders when a P1 is active
This playbook does not need to be long. A single page per alert tier is sufficient. The system removes the decision overhead that pushes teams to deprioritize alerts. When the next step is obvious, the response happens. You can read more about how Tatvic’s anomaly detection solution surfaces contextual intelligence that feeds directly into this kind of response workflow.
The Alert Playbook in Practice: What Good Looks Like
Here is what a P1 response looks like in a team that has built this system:
6:45am: Anomaly detection flags a 67% drop in mobile purchase events, isolated to iOS users, beginning at 6:10am
Alert routes to analytics lead with context: affected segment, magnitude, start time, and a link to the relevant GA4 exploration
Analytics lead opens the alert, has enough context to begin investigation immediately
By 7:15am: GTM configuration issue identified on an iOS-specific tag after a previous night’s deployment
By 8:00am: Fix deployed, tracking restored, stakeholders notified via a pre-written P1 communication template
Total time from anomaly onset to resolution: under two hours
Without a working analytics alerting system, the same issue surfaces in a Monday morning meeting. The team spends the first hour of the week diagnosing a problem that started the previous Friday. Three days of corrupted mobile conversion data have already fed into weekend campaign optimisation.
The difference is not the detection. As covered across the previous blogs in this series, the detection capability is available. The difference is what happens the moment the alert fires.
The Takeaway: Detection Is Only Half the System
This series started with a simple observation: reactive analytics finds problems after they have already done their damage. The blogs that followed showed what proactive monitoring looks like across anomaly detection, attribution, and data collection.
But proactive analytics is only complete when the detection layer connects to an action layer. An analytics alerting system that detects everything and acts on nothing is a more sophisticated version of the same reactive problem.
The full picture looks like this:
- Detect: Anomaly detection across metrics, parameters, dimensions, and attribution patterns
- Validate: Data sanity checks that confirm the signal is real before the alert reaches a human
- Alert: Contextual, tiered notifications routed to named owners with defined response expectations
- Act: A playbook that tells the recipient exactly what to do and by when
When teams connect all four layers: Detect, Validate, Alert, and Act – proactive analytics begins to deliver its full value: faster problem resolution, decisions backed by trusted data, and teams that act on alerts because the system has earned their confidence.
That is what a complete analytics alerting system looks like. And that is the standard worth building toward.
Ready to turn your analytics monitoring into a system that actually drives action? Tatvic’s team can audit your current alerting setup, identify the noise, and help you build a response playbook tailored to your business. Schedule a call with Tatvic’s experts today.