Your analytics setup might be lying to you right now, and you will not know until it is too late.
Here is what that looks like in practice:
- A tag fires incorrectly for two weeks, and no one notices
- A conversion event starts doubling due to a misconfiguration
- A campaign runs on corrupted attribution data for an entire month
None of these issues sends an alert. You find them when a stakeholder asks why the numbers look strange in a Monday morning review.
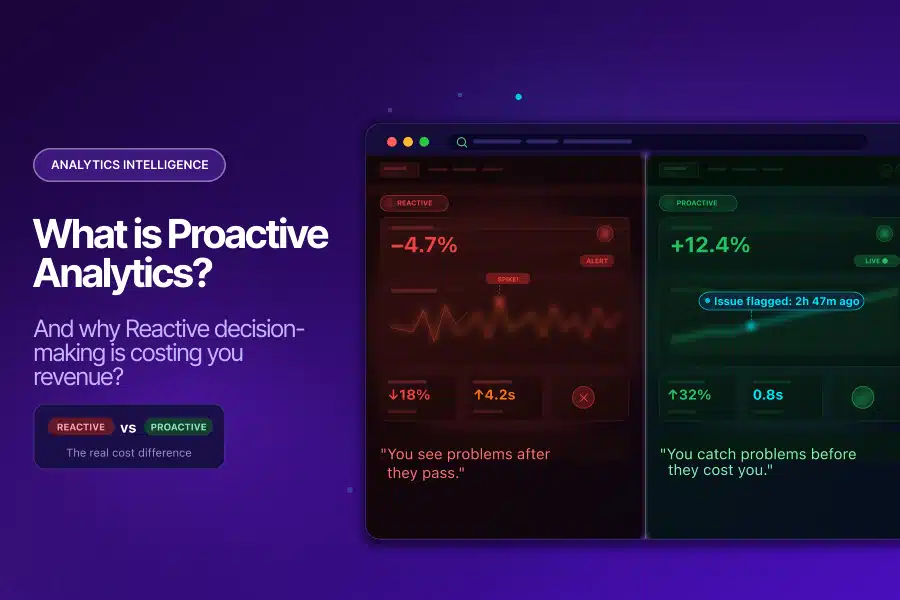
That is reactive analytics: discovering problems after they have already done their damage. Proactive analytics flips this model entirely, and in 2026, the cost of not making that switch is becoming impossible to ignore.
Why Reactive Analytics Is the Default (And Why That Is a Problem)
Most analytics teams are reactive by default. The pattern looks the same everywhere:
- Check dashboards after the fact
- Run audits on a quarterly schedule
- Investigate issues only when someone notices something that looks wrong
This is not a failure of effort. It is a structural flaw in how traditional analytics is designed.
Traditional BI tools are fundamentally retrospective. They surface what happened, not what is currently going wrong. By the time a reporting lag resolves and data appears in your dashboard, a pipeline error has already propagated through your BigQuery tables, your attribution models, and every decision made from them.
The Financial Reality of Bad Data
The numbers make this hard to dismiss:
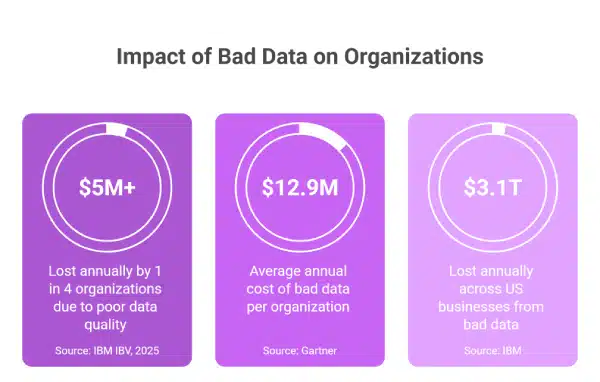
- A 2025 IBM Institute for Business Value report found that more than a quarter of organizations lose over $5 million annually due to poor data quality
- A Gartner study puts the average financial impact at $12.9 million per organization, per year
- IBM’s broader research estimates that US businesses collectively lose $3.1 trillion annually from bad data.
These are not abstract figures. They represent:
- Campaigns run on inflated conversion data
- Budgets optimized against fabricated ROAS
- Strategic decisions made from reports that were never accurate to begin with
The 1-10-100 Problem Nobody Talks About
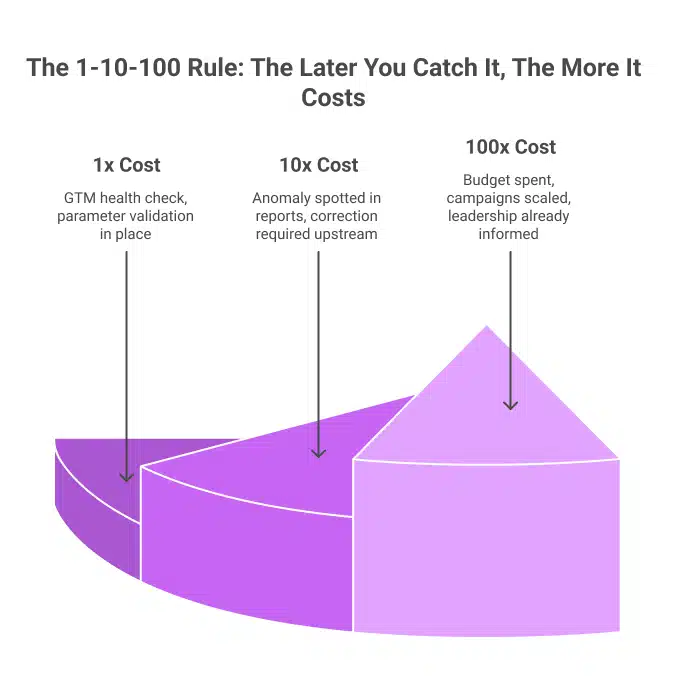
There is a well-documented principle in data management called the 1-10-100 rule:
- 1x cost to fix a data quality issue at the point of entry
- 10x cost to catch it midway through the pipeline
- 100x cost once bad data has reached the decision-maker
Reactive analytics almost always catches errors at the 100x stage. An analyst notices something strange in a report, traces it upstream, and discovers the issue began weeks ago. By then:
- Budget decisions have already been made
- Campaigns have been scaled on false signals
- The data that influenced those calls cannot be recovered
What Is Proactive Analytics?
Proactive analytics is an approach to data monitoring where issues are identified and flagged before they reach your reports and influence your decisions.
Instead of waiting for something to look wrong, proactive systems:
- Continuously monitor your data streams
- Learn what normal behavior looks like for your specific metrics
- Alert your team the moment something deviates
This is meaningfully different from setting static alert thresholds in GA4. Static thresholds:
- Miss anomalies that fall just below the trigger level
- Generate false positives that cause alert fatigue
- Cannot adjust for seasonal patterns or business cycles
True proactive analytics uses machine learning to:
- Continuously learn the baseline behavior of every metric being monitored
- Detect deviations that static rules would miss entirely
- Alert teams in near real-time with context: what changed, by how much, and since when
- Distinguish between genuine anomalies and normal variability, reducing noise
Why Reactive Analytics Is Getting More Dangerous
The complexity of modern digital measurement has grown considerably. The average marketing team now pulls data from 12 to 15 different sources: Google Ads, Meta, LinkedIn, CRM systems, email platforms, and analytics tools, each generating data in its own format, with its own quirks and failure modes. When these sources feed into a central analytics setup without automated quality checks, the result is not insight. It is noise disguised as insight.
Two dynamics are making this worse.
Data volume is outpacing human capacity. The global datasphere stood at over 147 zettabytes in 2024, with projections exceeding 175 zettabytes in 2025, according to IDC. No analytics team, regardless of skill, can manually monitor every metric, dimension, and event parameter at this scale. Reactive monitoring breaks down under this volume before it ever gets started.
AI tools are amplifying bad data. Organizations are investing heavily in AI-powered analytics, predictive models, and ML-driven attribution. However, AI trained on bad data produces bad outputs consistently. Research by Adverity found that CMOs estimate 45% of the marketing data their teams use is incomplete, inaccurate, or outdated. Nearly half the data feeding your AI models may be actively working against you.
What a Two-Week Detection Delay Actually Costs
Here is a scenario that Tatvic’s clients encounter more often than most would expect:
- A GTM misconfiguration causes purchase events to fire twice per transaction
- Conversion data doubles overnight
- ROAS looks exceptional, so the team scales the budget
- Two weeks later, a finance reconciliation reveals that the revenue numbers do not match
- The team traces the error back to the tag
Two weeks of corrupted data have already influenced budget allocation, campaign strategy, and leadership reporting. A same-day fix would have cost a fraction of the damage. This is not a hypothetical risk. It is the predictable outcome of reactive measurement.
What Proactive Analytics Looks Like in Practice
Shifting from reactive to proactive analytics does not require rebuilding your entire stack. It requires adding the right monitoring layer on top of what you already have.
Here is what the shift looks like in practice:
| Reactive | Proactive |
| Traffic drop found in the Monday review | Anomaly alert fires within 3 hours |
| Conversion parameter error found in the quarterly audit | Automated data sanity check flags it within 24 hours |
| GTM bloat discovered in annual performance audit | Continuous GTM monitoring catches it as it builds |
| An analyst spends 4-6 hours running a GA4 audit | Automated audit completes in minutes |
The operational improvement is clear. Tatvic’s AI-powered GTM health monitoring is one example of how continuous intelligence replaces periodic manual review, catching tag conflicts, ghost tags, and container inefficiencies before they affect data collection or site performance.
Is Your Analytics Setup Reactive? Check These Signs
Run through this quickly:
- Data issues are discovered in meetings, not in real-time alerts
- GA4 audits happen quarterly or only when something looks wrong
- Analysts spend more time validating data than analyzing it
- There is a known discrepancy between your CRM and GA4 that has existed for more than two weeks
- Your static threshold alerts either trigger daily (noise) or never trigger (blind spots)
- Your GTM container has not been reviewed in over 90 days
If two or more of these are true, your analytics posture is reactive. Each gap maps directly to a specific capability within a proactive analytics framework.
Where to Start: A Practical Order of Operations
The most common mistake when shifting to proactive analytics is trying to monitor everything at once. A smarter approach is to start where the risk is highest and build outward.
Step 1: Secure data collection integrity first. Your entire analytics stack is only as reliable as the data coming in. Start with GTM health monitoring and automated data sanity checks to ensure what reaches GA4 is accurate before it is ever analyzed.
Step 2: Add anomaly detection on your highest-value KPIs. Revenue, purchase events, and primary acquisition sources are where a silent anomaly does the most damage. Intelligent, ML-driven monitoring on these metrics gives you early warning where it matters most.
Step 3: Build a response workflow. An alert without a playbook is just noise. Define who receives each alert type, what action is expected within the first hour, and how issues escalate. This is what turns proactive analytics from a monitoring tool into a business protection system.
The market is already moving in this direction. Grand View Research values the global predictive analytics market at $18.89 billion in 2024, projecting growth to $82.35 billion by 2030. The organizations driving that growth are not waiting for problems to show up in weekly reports.
The Takeaway
Reactive analytics is not a strategy. It is what happens when an analytics setup built for a simpler era meets the complexity of modern digital measurement. The volume of data, the number of sources, and the speed of decisions have all outpaced the pace of manual monitoring.
Proactive analytics does not demand a complete overhaul. It demands the right monitoring layer, the right alerting logic, and a team or partner who understands how to build them for your specific data environment.
Every analytics setup has issues. The question is whether you are finding them before or after they influence a decision that matters.
Not sure where your analytics setup sits on the reactive-to-proactive spectrum? Schedule a call with Tatvic’s analytics experts today!