
In this blogpost, I want to dive deeper into the explanation of the relationship between Frequency and Recency of Visits with the Conversion Rate and Average Order Value. I have used the RGA package for data extraction and Dr. Hadley Wickham’s ggplot2 package to achieve the visualizations.
Here’s the data aggregation script :
#transactions dataframe contains the input data extracted via RgoogleAnalytics

head(transactions, n = 3)

#  visitsToTransaction daysToTransaction transactions transactionRevenue
#1                   1                 0         1639           11505429
#2                  10                 1            1               3700
#3                  10                10            1               6050

transactions$visitsToTransaction=(3*i-2)&transactions$visitsToTransaction=(3*j-2)&transactions$daysToTransaction
We now convert our data into a visualization using the ggplot2 package. Here’s the command:
require(ggplot2)
aov

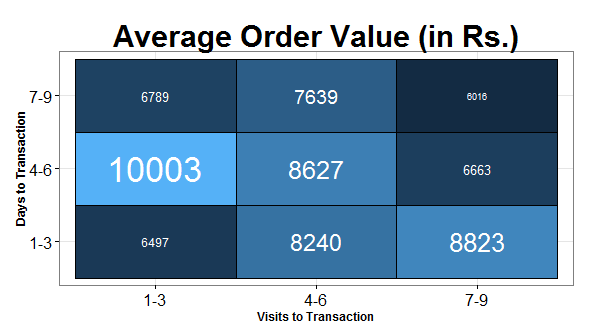
Let us make some quick inferences:
- When the consumers visit 1-3 times across a period of 4-6 days they tend to buy the most expensive products
- When they visit the site 7-9 times across a very small period of 1-3 days, these might be the consumers who visit repeatedly to keep a tab on offers and prices of a product of their choice they too have a higher Average Order value
- Spontaneous buying decisions are made when the Visits and Days to Transaction are in the 1-3 categories. As expected, the average order value for these transactions is on the lower end.
Let us do a similar exercise for the Conversion Rate. We extract data corresponding to the dimensions: Visit Count, Days since Last Visit and Metrics: Visits. Repeat the same steps as before. We already had the Transactions binned and categorized earlier. We now divide the total number of Transactions across each category to the Total Visits in order to get the Conversion Rate and plot it.
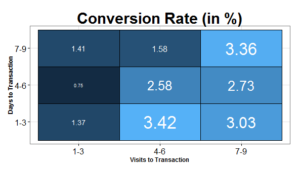
Both the plots stacked up together help us understand the relationship between the Average Order Value and the Conversion Rate which in this case seems to be an inverse relationship i.e. AOV tends to be higher when Conversion Rate is the lowest. Now, this correlation may not imply an underlying causation therefore we need to drill down further to verify our hypothesis.
Consumers do tend to visit the website multiple times before making a purchase. Some might buy right away, but most of them will research a bit and come back. With this realization, we could focus on giving them more information to help with their research and getting them to convert at their own pace. On the other hand, if the time period is short (for e.g. 1-3 Visits in 1-3 Days) and the purchase is more spontaneous we have some room for improvement here (Average Order Value: 6497, Conversion Rate 1.37 %). We could play with pricing strategy and thereby to increase the Average Order Value or provide a referral discount and get more consumers to convert. Of course, this has to be done keeping the site’s business objective in mind.
Would you like to understand the value of predictive analysis when applied on web analytics data to help improve your understanding relationship between different variables? We think you may like to watch our Webinar – How to perform predictive analysis on your web analytics tool data. Watch the Replay now!
