Make data your biggest asset with Tatvic's GA4 expertise
Transform your high-volume raw data into meaningful insights with Tatvics’ enterprise-grade GA4 Service.

Why Choose Tatvic as your GA4 Partner?
At Tatvic, we don’t just provide data; we offer insights that drive results. Our outcome-driven approach helps you acquire, activate and retain customers seamlessly across every customer journey.
Elevate Acquisition
With Tatvic's GA4 solutions, you can pinpoint exactly where your audience becomes a qualified lead and improve your customer acquisition efforts.
Drive Engagement
Have more engaged customers as we help you track user behaviors and interactions across customers' touchpoints for data-driven marketing activations.
Improve Retention
By leveraging user behavior insights, Tatvic helps you create content and channels that engage and retain users.
What sets us apart?
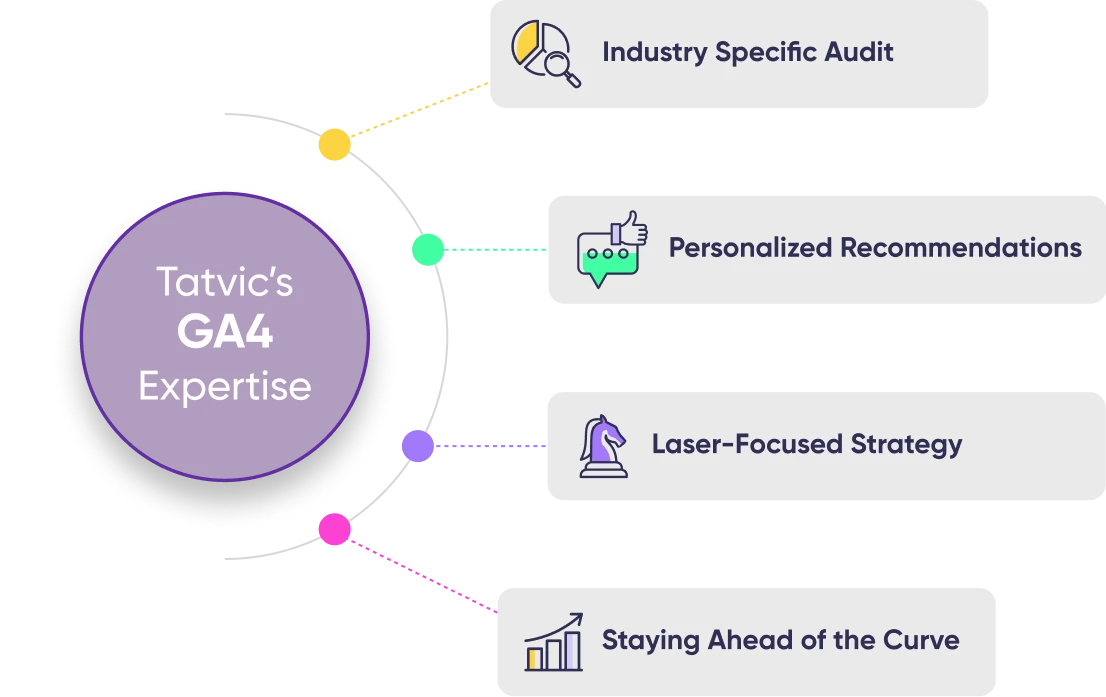
Our detailed and dedicated approach to implementing GA4 ensures you get the most accurate insights, helping you make data-driven decisions for your business.
- Understand unique customer behaviors and conversion patterns.
- Decode crucial metrics that matter for your industry.
- Draw valuable recommendations that help your generate insights that aligns with your KPIs
- Tailored suggestions aligned with your sector.
- Data collection geared towards industry-specific goals.
- Craft strategies that resonate with your audience.
- Sector-specific approach for enhanced engagement and conversions.
- Adapt to evolving market dynamics.
- Maintain a pertinent analytics approach.
- Ensure your strategy aligns with industry shifts.
- Leverage updated insights for strategic advantage.

Leverage Tatvic's Premium GA4 Services
Seamless GA4 Migration and Implementation
Tatvic's experts ensure seamless transitions, safeguarding your website's performance and your data-driven decisions while mitigating the risks of broken tracking, disrupted reporting, and lost data. Further, our services also include auditing current setups, mapping it to the new site, and accurate implementation.
Comprehensive Tag Management
In the modern digital landscape, where data-driven insights are paramount, having an efficient and organized system for managing tags is essential. Tatvic's Tag management services enable businesses to deploy and update tracking codes, conversion scripts, and other essential elements with ease!
Leverage ML Based Modelling
We help you maximize the value of GA4's machine learning and predictive modeling capabilities. This means the platform evolves with your data, offering insights that can anticipate future trends. These predictive insights empower you to proactively adjust strategies and stay ahead of market shifts.
Unveil Advanced Analysis Reports
GA4 isn't just about numbers – it's about insights. Our expertise helps you dive deep into advanced analysis reports, revealing intricate patterns, trends, and correlations that shape your audience's behavior. This knowledge arms you with the insights needed to fine-tune your strategies.
Words we live for

Amogh Dusad,
SVP & Head - Programming,
SonyLIV

Jatin Chikara
VP of Marketing
Royal Enfield

Senior SEO Analyst
Leading HCM Provider

Ratish Krishnanunny,
AVP - Website Experience & Partners Integration.

General Manager, Digital Marketing
An Indian eCommerce Giant
Let Your GA4 Drive Remarkable Business Growth with Tatvic
- Ensure an accurate GA4 Implementation
- Track the right metrics effectively.
- Generate valuable insights with precision

Case Study

60%

37%

22%

25%
FAQ's
- GA4 offers advanced tracking and analysis features that provide a deeper understanding of user behavior on your website.
- It provides cross-platform tracking, allowing you to analyze user interactions across web, mobile apps, and other digital platforms.
- GA4 includes enhanced reporting capabilities, including predictive metrics and machine learning-powered insights.
- It offers event tracking and conversion modeling for more accurate attribution and ROI analysis.
- GA4 is designed to adapt to privacy changes and regulations, ensuring data compliance.
GA4 360 offers significantly higher limits for event parameters, custom dimensions and metrics, user-scoped custom dimensions, conversions, audiences, explorations, explore sampling, unsampled results, API quotas, data retention, and BigQuery export compared to GA4 Standard. GA4 360 is designed for enterprises with more extensive data needs and analytics requirements.
Yes, you can run GA4 alongside Universal Analytics for a transition period. However, Google recommends setting up GA4 as soon as possible to benefit from its advanced features and future updates.
GA4 offers enhanced event tracking, machine learning-powered insights, cross-platform tracking (websites, apps, and more), audience building, and BigQuery integration, among other features.
Yes, GA4 supports mobile app tracking, making it suitable for businesses with both web and app properties. It provides unified data measurement across platforms.
Event-driven tracking in GA4 allows you to track user interactions and events on your website or app, providing detailed insights into user behavior, such as clicks, page views, and custom events.
Yes, GA4 has data retention limits that vary depending on the version (Standard or GA4 360) and property size. You can choose different retention periods based on your needs.


