

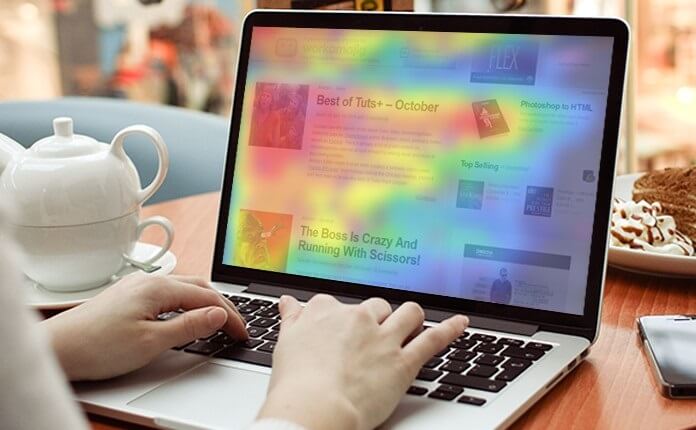
In our previous blog on Heatmap, you read about how important heatmap integration is. It enables us in generating faster insights owing to visualization of each click by a user. Heatmaps can help a market place company achieve revenue optimization by identifying the most optimal banner placements on their website or could be helpful to media company in understanding what news or content draws higher user attention.
Some of Tatvic’s clients have already integrated heatmap on their websites and uncovered some surprising insights. In this blog, I am listing down few of the most interesting insights which I came across while working with different clients.
- Find Your Hidden Gems
One of India’s top local service providing web platform has found some interesting insights which web analytics data cannot give. On quick evaluation of their home page using the Heat Map showed some very clear warm spots of the user interactions. Surprisingly enough, those warm spots were not actually clickable sections but many users on their site clicking on that section, expecting some actions. Now, had we been relying only on the analytics data in the form of numbers, one could not draw attention towards the said user behavior. However, owing to the Heat Map it became very clear that these warm spots can be made actionable and results into a better user engagement on the site.
Another very interesting case that I’d like to share with you is that of an online real estate platform for buyers and sellers. The Click Map showed that among their most sought after elements on the website was a specific PDF document regarding certain property regulations. This document was on a page which served no other purpose than to simply host this document. With our click map integration, we could draw attention on this specific document. The document in question was then made available for download directly from the home page, which is the entrance of website and having number of options available for user to navigate the website and that resulted into better quality of the user journey funnel.
- Your Most Popular Content Might Not Be Your Own
For one of our clients that is a news website, their most popular content on their website was a table of stock exchange rates. The exchange rates were presented in a widget close to the bottom of the home page and Tatvic’s Scroll Map showed that, in general, visitors were willing to scroll so as to find them. That table was provided by a third-party plugin, so the cursor activity would not have been picked up by a regular event tracking activity but with the help of Scroll Map, their team could identify that a significant amount of their users came to their site for this specific piece of information. This insight was quite surprising as it turned out that the table of stock exchange rate was not even present on the mobile version of the home page, making it difficult for visitors who relied on this website for information to check current exchange rates on the go.
- Unnecessary Content on Page – Breaking Conversion Funnel
In case of one of our e-commerce clients, their checkout funnel was showing an unusually high drop off on the first two stages: cart detail page and address detail page respectively. Identifying the exact reason for high drop off on these pages was difficult from the analytics reports. During such situations, implementing heat map was one of the best solutions we could come up with. It gave us an alarming insight that we hadn’t not noticed based on analytics data. Like all other pages of the website, cart detail page and address detail page had navigation bar present in the head section of the page, which was drawing user’s attention on that page and getting more clicks compared to the proceed to checkout button. This resulted in a break in the conversion funnel. After identifying this, they addressed the issue by removing navigation bar from those pages, leaving the only option for user to click on proceed to checkout.
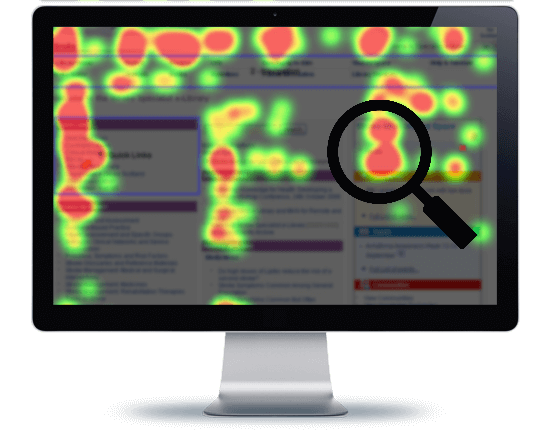
Although analytics tool can give you an in-depth information through various reports to generate an insight, it is painful going through multiple reports to zero in on most useful insights. It is time consuming. For such times, a solid visualization of data can make life easier to get actionable insights quickly. H eat map is one such visualization where every single action performed by a user on your web page is presented.
Also, an added advantage is that your top management would love to look at data visualized rather than mundane tables. Easy to explain data backed insights and take faster decisions!!!
Tatvic’s Heat Map integration was developed and designed with web editors in mind and we took care in designing this integration in a way that would increase satisfaction for those working with websites daily. The idea is to optimize the web presence considering actual user interaction on the site.
Unlock the full potential of your website now! Leave a comment below or get in touch with us today and get these tools implemented for further details!


