If you are using Google Analytics API or any other third-party Excel Add-ins that use the API, you might have faced some issues. e.g., reporting of values in different formats as compared to reports from the GA web interface.
One common issue is also observed where the average time on site is presented as a skewed number which we cannot understand. This happens when we extract reports from Google Analytics API or Excel add-ins.
In this post, we’ll discuss how to identify the different formats of the “Time on site & Avg. time on site” value in Excel Add-in and GA web interface and convert it into proper time(“hh:mm: ss”) format.
The problem
Let’s take a case for example.
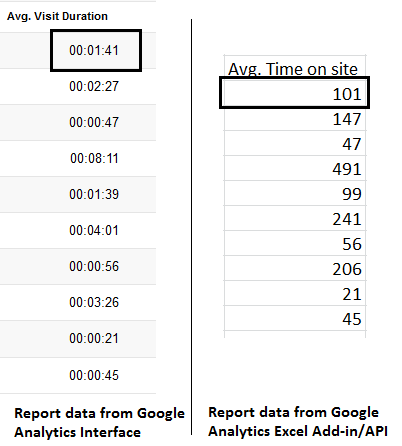
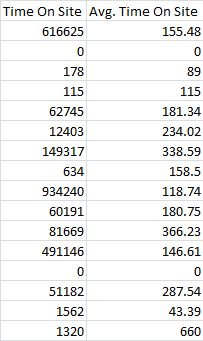
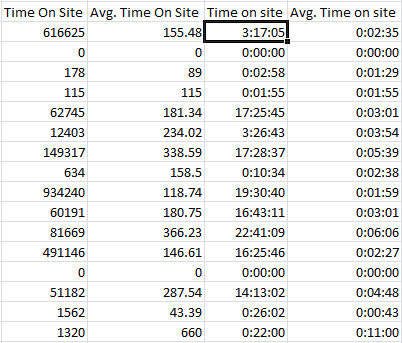
Google Analytics API returns the “Time on-site” and “Avg. Time on site” values as total seconds (i.e. 616625 instead of “3:17:05”). For example, I am using the Tatvic Excel Add-in for generating the Google Analytics reports. Here, I am generating a simple report which contains the dimension “Medium” and metrics as “Time on Site” & “Avg. Time on Site”. So this will return the result as shown in the screenshot below (the “Medium” column is not shown here).
Because Google Analytics API will return the Total no. of seconds spent on the site instead of the “h:mm: ss” format like the GA web Interface presents (as shown in the screenshot below).
So while we are dealing with the API response in Excel, we must need to format the values of “Time on-site” and “Avg. Time on-site” using Simple Excel formulas and format.
Solution
The above values are just numbers for any user until it’s not in a proper format. Now, we will format the values using simple steps:
- Convert values into hours
- Format value in “h:mm: ss”
- Apply the formula and format to all the cell values
Apply for both, “Time on site” & “Avg. Time on Site”:
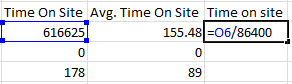
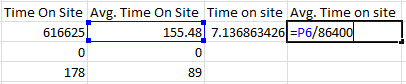
In a new column next to the “Time on site” & “Avg. Time on site” columns, select the first cell in the column and apply the following formula:
Or
=(Cell Address of the time on site)/60/60/24
Here, 86400=24*60*60 (Because, 24hr in a day, 60 minutes in an hour, and 60 seconds in an hour).
For Time on site:
For Avg. Time on site:
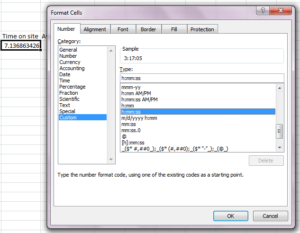
Now, Format the cell using the “Custom” cell format as shown below:
-
-
- Right-click on the Cell and select “Format Cells”, which will open a window as shown in the screenshot below.
-
![]()
Now select the cell of the new “Time on site” copy the value by “Ctrl+C” and paste it by “Ctrl+V” on a full column of the new “Time on-site”. Now apply the same thing for the “Avg. Time on site” even, which will result as shown below:
That’s it.
Here “Time on site and Avg. Time on site” are formatted as you get results in the Google Analytics User interface.
If you are facing any other issue like this with Google Analytics reporting via API or Excel Add-ins, then feel free to post here as comments or send a mail to sachin[at]tatvic[dot]com.
Would you like to reduce the amount of time you usually spend on data extraction from your Google Analytics / Google Adwords account? We think you may like to watch our Webinar – How to Simplify and Automate the data extraction process using Tatvic Excel Plugin. Watch the Replay Now!