
As a data analytics consulting firm, we think we are fortunate that we keep finding problems to find. Recently my teammate found a glaring problem of not having any connector for R with Google. With inspiration from Michael, and Ajay O, it soon becomes a worthwhile problem to solve.
With the RGoogleAnalytics package now, we have solved the problem of data extraction into R from Google Analytics a new breed of ideas started emerging primarily around visualization. I have been playing with GGplot2 has been a great package to convert data into visualization. Thanks, Dr. Hadley Wickham. Once you have followed this blog post, you are with the code there in a position to have the data required to get these calendar heatmaps done. Take up the below-given code and paste it into the R console and play around to see if you find it easy to work thru. If you have trouble, feel free to reach out to us.
Here is the code for extracting the Google Analytics data using the R-google Analytics package. Before running the following code, download the RGoogleAnalytics package and install it.
#Load RGoogleAnalytics library
library("RGoogleAnalytics")

# Create query builder object
query
For this example of a Calender heatmap, I am using data from an e-commerce store with data for more than 2 years in business. I will be plotting visits as well as transactions on the calendar so that I’d get perspective on how they interact viz-a-viz timeline.
Here is the code for plotting the heat map after you get data and have it stored in ‘data’. This frame is used to reference the source of data for the visualization below.
# Recommended R version - 2.15.1 or higher
# install required  library by using the command install.packages(“libraryname”)
# For example install.packages(“ggplot2”)
# Required library
library(“quantmod”)
library(“ggplot2”)
library(“reshape2”)
library(“plyr”)
library(“scales”)

# Set extracted data  to this data frame
data
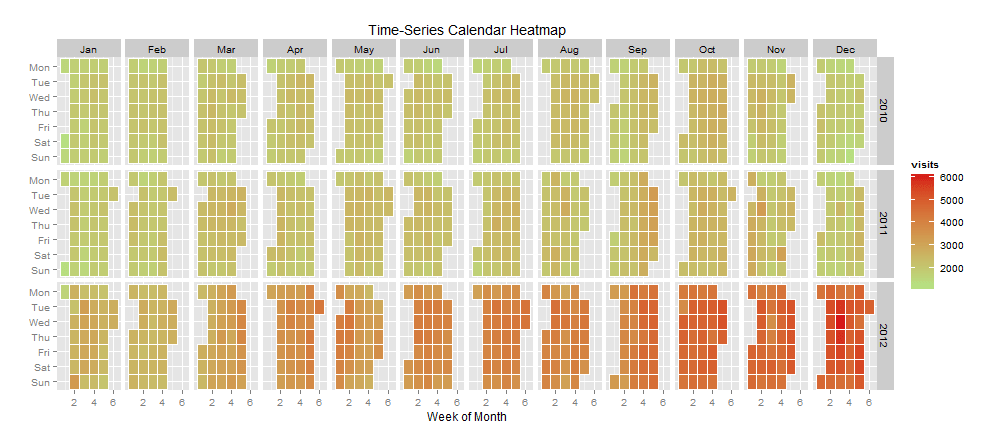
Once you run the code, you will be in a position to get the output like the below:

Now that we have a calendar heat map for visits, let me pull it off for transactions. In the above code for Google Analytics data extraction, you have to use transactions as well as visits as metrics. Since the data is already available in the ‘data’. we are ready by changing in code of visualization to choose the heat map for the transaction now.
![]()
It’s quite interesting now that you can make super nice inferences as I did below:
- Tuesdays have high visits days but Wed has been the day when most transactions occur.
- Visits increase towards the end of the year (shopping season) and then slow down towards the year’s start.
Visualization is an interactive process. Based on the feedback received from some of our readers, I tried plotting both KPIs on the same graph. With ggplot2, it was as simple as adding a line of code. Again some minor tweaks in the background colors and we are ready with another heat map.
ggplot(data, aes(monthweek, weekdayf, fill = visits)) +
 geom_tile(colour="white") +
 facet_grid(year~monthf) +
 scale_fill_gradient(high="steelblue",low="white") +
 theme_bw() +
 geom_point(aes(monthweek, weekdayf, size=transactions,alpha=transactions),color="firebrick") +
 theme(panel.grid.minor=element_blank(), panel.grid.major=element_blank()) +
 labs(title = "Time-Series Calendar Heatmap") +
 xlab("Week of Month") +
 ylab("")
![]()
Would you like to understand the value of predictive analysis when applied to web analytics data to help improve your understanding relationship between different variables? We think you may like to watch our Webinar – How to perform predictive analysis on your web analytics tool data. Watch the Replay now!
