


Introduction
Once we implement the tracking code on a website, the Google Analytics data starts flowing in a particular Google Analytics property. Therefore, it is important to know how various data points can be accessed by understanding the various offerings of the Google Analytics Reporting Interface. Also, in the time-bound schedules of digital marketers and analysts, it becomes essential to identify which information will be accessible from which reporting section. Once the appropriate report is there in front of users it is essential to know various Reporting Features so as to make the data more meaningful and customized according to user’s requirement. In this blog, we are covering the basic features of Google Analytics Reports along with a few use cases.
About Reports
One can avail over 80 reports using the Google Analytics data that are chiefly divided into the below-mentioned parts.
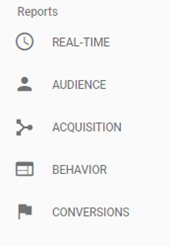
What my users are doing right now?
Who are my users?
From where are my users coming to the Website/App?
What are they doing on my Website/App
How many of them are driving conversion and how?
Basic Features of Google Analytics Report
To get an idea about the basic features of Google Analytics Report, we are considering Source/Medium along with Browser and OS report as a base. You can write the name in a search box available on the left top corner of the Google Analytics Interface. You will get the below-mentioned output upon clicking that icon.
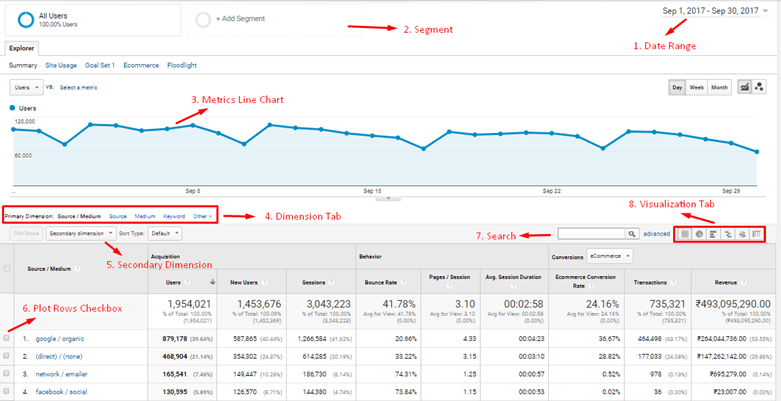
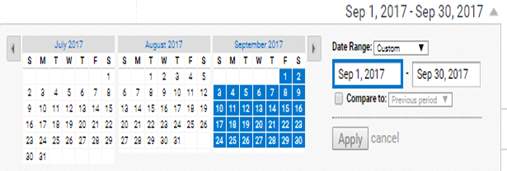
1. Date Range
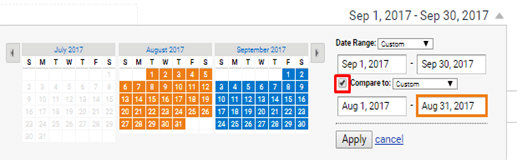
You can select the date range for which you want to access the Google Analytics data. Over here, the compare function is available – allowing you to compare a particular date range with the other one. It gets really simple and quick to avail daily, weekly, monthly, and yearly data from this feature. It is also possible to fetch the event data for any custom date range.
2. Segment
You can add various segments to analyze the Google Analytics data for a particular set of audiences. Here are a few examples of segment definitions:
- The user Type exactly matches “Returning User”
- Country/Territory does not matches “United States”
- E-commerce Conversion Rate > “0.2%”
You can create different types of segments based on your need to analyze the Google Analytics data. While creating a segment, multiple dimensions and metrics are considered. The segment remains as it is even if you open another Google Analytics Report after applying a particular segment.
3. Metrics Line:
It is the line showing the Metrics trend for a particular period. By default, this is set to daily frequency for the date range selected. You can get this line chart with a frequency set to week and month as well. The line chart for any particular metrics is also available from the metrics drop-down option.
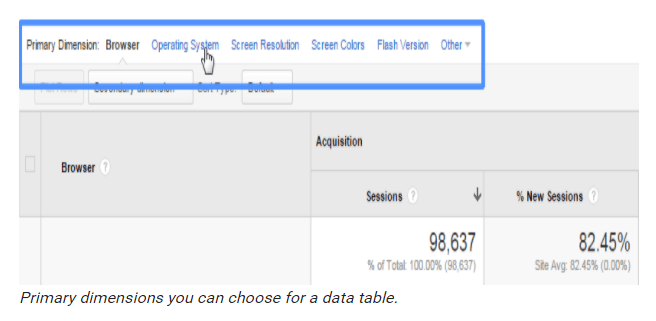
4. Dimension Tab
This tab is useful in changing the value of the primary dimension. E.g. If you want to pull data based on the Operating System instead of Browser then this tab becomes useful.
5. Secondary Dimension: This feature is essentially used for adding another dimension along with the primary dimension. E.g. if you want to add gender along with the browser then a secondary dimension becomes useful.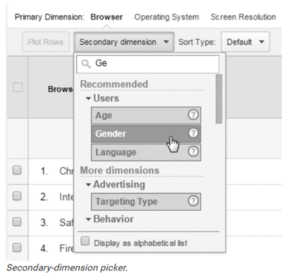 You can also add a tracked custom dimension using this feature. In case you want to use more than one custom dimension, then there is an option to create a custom report where you can select up to five dimensions/custom dimensions. For this, you simply need to perform the drag-and-drop actions to add or remove dimensions/metrics.
6. Plot Rows Checkbox
In case you want to see a metrics line (as mentioned in point 3) for a particular dimension value (e.g. only for Chrome and Mozilla browsers from the list of all browsers)you need to tick on the checkbox(es) and then what you get is the line chart only for those dimension values.
7. Search
Marketers can search for a particular dimension value using the search feature to fetch the Google Analytics data that is limited to the selected dimension value.
8. Visualization Tab:
This tab allows you to generate the report output in the form of a percentage chart, comparison chart, pivot table, etc. It comes in handy when you or your team require dynamic outputs of Google Analytics data in a particular format.
9. Other features:
- Sort:
You can simply click on the top of this metric column to sort your Google Analytics data in a particular metric, either in ascending or descending order
- Save:
This feature lets you save a particular report by clicking on the Save option available at the right top of the Google Analytics Interface. You can access the same from Customization > Saved Reports.
- Export:
One can generate Excel, spreadsheet, .csv, and .pdf versions of the reports created using Google Analytics Data by clicking on the Export option available at the top-right corner of Google Analytics Interface.
- Edit:
You can edit the dimensions and metrics by clicking on the Edit option available at the top-right corner of the Google Analytics Interface. Click here to know more about the usage of this button.
- Share:
With this feature, share the report configuration by clicking on the Share option available at the top-right corner of the Google Analytics Interface.
Frequently Encountered Questions
Here we are addressing a particular set of questions that you would generally encounter while trying to obtain Google Analytics data based on pre-determined data points.
- Is there any report available from which I can get data for the number of drop-offs from a particular conversion funnel?
- Yes, there is a report called Funnel Visualization which helps in getting such data. One needs to define a destination goal with funnel steps to obtain Google Analytics data in this particular report.
- Can filters be applied to real-time data? Also is it possible to automate this process daily?
- Yes, one can always create a real-time dashboard from Customization > Dashboards with filters. The same can be automated using the email option with daily frequency.
- How to access a custom dimension sent with an event?
- A custom dimension sent with an event can either be taken as a secondary dimension in a particular report or one can opt to create a custom report for the same.
- Can someone use offline data in a Google Analytics Report?
- Yes, one can always use the data import feature available in Google Analytics and once the offline data flows in Google Analytics Custom Dimensions, it is best put to use by a secondary dimension or a custom report where your offline data will merge with the Google Analytics data.
- Can someone get data for different segments at the same place?
- Yes, you can either apply up to four segments for the same report or dashboards with many reports with different filter condition that are possible to create.
Conclusion
Let us conclude with a few general points that one should remember about the data that is available in Google Analytics Reports:
- Google Analytics data can migrate to the data studio, adwords, tableau, and Bime. Since it has a free API with additional custom development, it is possible to integrate the same with any other visualization tool.
- All the user interaction data (hit level) can be sent to Google Analytics and can be accessed through Reports available under the Behavior Section.
- Apart from Real Time Reports, for other reports, it takes 4 hours to process the data for Google Analytics 360 and 24-48 hours for Google Analytics Standard.
This blog is aimed to deliver to you, the importance of each report as you navigate through various reports. This will enable digital marketers to derive desired data points with the knowledge of various reporting features.
