In today’s data-driven business landscape, understanding the factors driving your revenue is key to making informed decisions and optimizing your operations. Looker Block for Revenue Contribution Analysis
Revenue Contribution Analysis with Looker is a powerful technique that enables you to decode the various factors contributing to your total revenue.
By gaining insights into the channels, product categories, device categories, or geographic regions that play a pivotal role in your revenue generation, you can fine-tune your strategies based on the analysis for maximum profitability.
This Article address:
- The significance of Revenue Contribution Analysis in shaping your business strategy
What are “Blocks” in Looker BI?
Looker Blocks are pre-built templates or modules within the Looker data platform that streamline and simplify common data analysis tasks. They contain pre-configured data models, dashboards, and visualizations tailored to specific business needs or analytics use cases.
Looker Blocks enables users to quickly generate insights and reports without extensive coding or data modeling expertise, accelerating time-to-insight and enhancing decision-making capabilities.
These blocks cover various areas such as revenue analysis, customer segmentation, marketing attribution, and more, providing a foundation for users to build upon or customize according to their specific
The Significance of Revenue Contribution Analysis in Business Strategy:
Revenue Contribution Analysis is all about breaking down your revenue into its components to understand which elements are the most significant contributors. It allows businesses to identify key factors such as Users, Conversion Rate, Cart Size, and Average Price that play a pivotal role in revenue growth.
Doing Revenue Contribution Analysis in Looker is a streamlined process that leverages the platform’s analytical capabilities. Looker seamlessly integrates data & allows for a comprehensive analysis of Users, Conversion Rate, Cart Size, and Average Price and its effect on revenue. To understand this relationship better and take a deep understanding of the same, we have built the Looker Block that enables us to make data-backed decisions.
An Overview of Tatvics’ RCA Block in Looker:
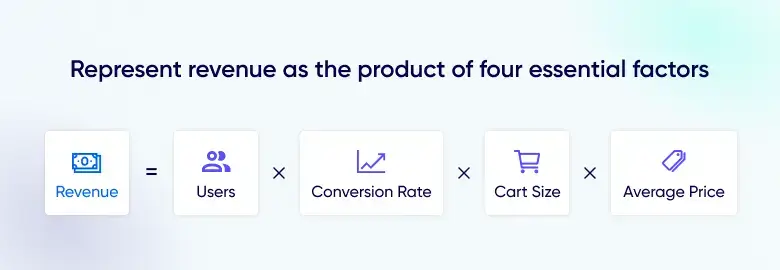
This Looker block focuses on analyzing the impact of changes in specific key drivers on e-commerce revenue. Within this framework, we represent Revenue as the product of four essential factors:
Here:
- Users represent the total number of visitors to our website.
- Conversion Rate indicates the percentage of visitors who make a purchase.
- Cart Size refers to the number of products in a cart during a transaction.
- The average price represents the mean revenue generated per product.
With the help of the LMDI growth decomposition method, we estimate revenue change over any period. Analyzing Revenue Change with LMDI in Looker: To estimate revenue change over any period, Looker and the Looker Block employ the LMDI (Logarithmic Mean Divisia Index) growth decomposition method. It breaks down the change in revenue as follows:
This equation identifies and quantifies the contributions of each driver to revenue growth, allowing businesses to pinpoint the areas with the most significant impact on their bottom line.
Benefits and Potential Insights from Using Tatvics’ Revenue Contribution Analysis Block in Looker:
Looker is a modern data platform that allows organizations to harness the power of their data. Integrating Revenue Contribution Analysis with Looker can offer multiple benefits and insights.
1. Deep Data Analysis:
Identifying the root cause of issues is crucial for making effective changes. Looker can help you go beyond surface-level metrics and uncover hidden patterns in your data. This can lead to a better understanding of campaign performance, customer behaviour, and overall marketing effectiveness.
2. Data-driven Actions:
Once you have deeper insights, you need to translate them into actionable steps. Looker can help you pinpoint exact problems and identify the most impactful actions to take. This data-driven approach can lead to more successful marketing campaigns and improved ROI.
3. Planning Marketing Campaigns:
Proactive planning is essential for successful marketing. Looker’s predictive capabilities can help you anticipate potential issues before they arise and adjust your campaigns accordingly. This can save you time, money, and resources in the long run.
4. Integration:
Breaking down silos is key to maximizing data utilization. Looker’s integrations with various platforms like Slack allow you to share insights instantly and facilitate real-time collaboration within your team. This can lead to quicker decision-making and faster reaction times.
5. Embedding:
Making data readily accessible is crucial for informed decision-making. Looker’s embedding features allow you to put dashboards and specific data points directly into the tools your team uses most. This ensures everyone has access to the information they need when they need it.
Overall, these features showcase how Looker can be a valuable tool for marketing teams by providing deeper insights, driving data-driven decisions, and facilitating proactive planning and collaboration.
Here are some additional questions you might consider:
What specific marketing challenges are you currently facing?
What data sources do you have access to?
How do you envision using Looker to improve your marketing efforts?
By understanding your specific needs and goals, Tatvic can provide more tailored advice on how Looker can benefit your marketing team.
In conclusion, Revenue Contribution Analysis with Looker Blocks transcends conventional data analysis, offering a simplified yet comprehensive approach to revenue understanding.


