
ECommerce reporting and insights with Google Analytics 4-
GA4 eCommerce reporting provides a detailed understanding of a user journey through your sales funnel. They also measure the impact of promotions and product placement on revenue and conversion rate.
If you run an eCommerce business, it is important to map your sales data against the average time spent on various sections of the website/app. Additionally, Google Analytics helps map product-wise categorizations to further analyze the eCommerce reports for website optimizations.
Google Analytics (GA4) will help you get these must-have insights sorted with its default reports. However, with a few schema differences between Universal Analytics and GA4, we recommend going through the Google Developers Guide first to ensure accurate set-up and data tracking.
Once you have high-level insights on revenue, you would also want to understand how users behave on your website before purchasing a product. For instance, ‘Did a user drop out of the journey after adding a product to the cart or before adding to the cart?’ What if you also want to understand some micro-level details – ‘Are users transacting more from mobile devices as compared to the desktop in the evenings?’
Let us see how to use Google Analytics 4 to generate those insights. If you are aware, you can start planning your ga4 migration journey today!
Analyze Shopping Journey:
On arriving at your eStore, a user starts his journey by viewing a list of products/categories/items → navigating to item detail → adding an item to the cart → making a purchase.
Check the funnel, which can help you analyze the ratios like product-view to transactions, add-to-cart to transactions, and such.
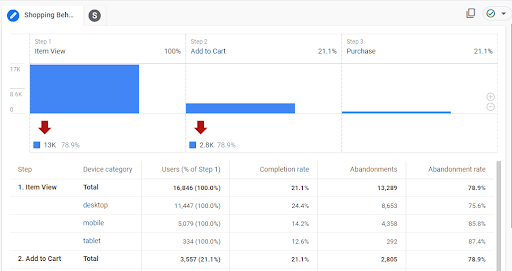
Did you notice an additional dimension of the Device category? It helps generate insights like users with desktop devices have the highest completion rate of 24% and this is true for all the funnel steps.
Some strategic insights on remarketing can also be obtained via this Google Analytics report. For example, we can run specific campaigns to nudge users to add items in the cart through additional deals, if the ‘item-view’ to ‘add-to-cart’ ratio is low.
Once the user reaches the checkout stage, the probability of him purchasing increases. This is the time when you should focus on decreasing the time he spends on the checkout journey and make an immediate decision to purchase. The question is how do you understand which user goes through all steps of checkout or leaves it midway? To assess this, you might want to look into the checkout journey steps in detail.
Now let’s see how we can generate such insights with an eCommerce reporting feature.
Analyze Checkout Journey:
Let’s say we have analyzed shopping behavior and our cart additions have increased at a higher rate as compared to transactions. In this scenario, we need to analyze a user’s checkout behavior.
There are several steps that a user takes between checkout and final purchase. These steps include adding personal information, shipping details, reviewing filled details, etc. The following funnel would give you a deeper understanding of the user’s checkout behavior:
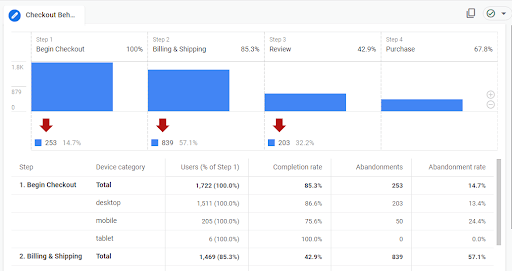
The funnel here shows that maximum users are dropping off from step 3 – Review step. Based on this, we can decide if it is the number of steps in the checkout process hampering a user’s purchase intent or poor user experience.
Decisions based on the funnel data can directly impact transactions and/or revenue.
When we look at the funnels above, one important point of consideration is user drop-off. There would be stages where you see huge drop-offs creating bottlenecks for the next steps. What would be your next action on this data?
Analyze Drop-offs:
Identifying a point from where a user drops off is an important area to look at. It creates a roadblock in the conversion/purchase journey. Each step will let you create a segment and then analyze those users or retarget them in marketing campaigns.
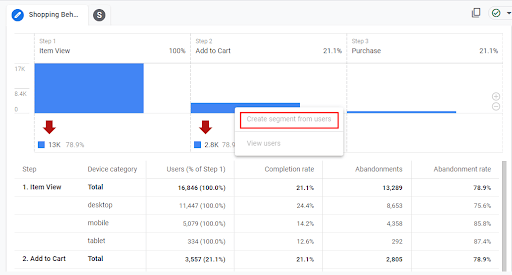
Additionally, you can use other parameters (secondary dimensions) to dig deeper into the funnel. This will give you granular insights.
You might be interested in device-wise breakdown to analyze drop-off. Let’s consider that the completion rate of step 1 is the highest for desktops. Based on this, you can target customers for desktop with a higher campaign budget as compared to mobile. You can take a similar approach to the abandonment rate which is higher for mobile by adjusting your campaign spending or running more retargeting campaigns to improve overall performance.
The next important thing for a business is to be able to improve ROI based on optimized user targeting. For example – ‘How do you segment a customer as a loyal customer, is it based on frequency or value?’, ‘How would a particular segment of users impact the overall revenue?’ and so on.
Let’s understand the capabilities of GA4 in eCommerce Reporting.
Predictive Insights:
Predicting the effectiveness of your marketing spend is an important aspect and so is keeping an eye on the revenue. What if Google Analytics 4 makes your work easier? With the implementation of the purchase event in GA4, we can unlock the predictive metrics and machine learning capabilities.
What benefits do we get by unlocking the predictive metrics?
- Purchase Probability: The probability that a user who was active in the last 28 days will log a specific conversion event within the next 7 days.
- Churn Probability: The probability that a user who was active on your app or site within the last 7 days will not be active within the next 7 days.
- Revenue Prediction: The revenue expected from all purchase conversions within the next 28 days from a user who was active in the last 28 days.
With this, we will be able to set up predictive audiences. For example, likely purchasers in the next 7 days and use them for remarketing. This eventually will help us optimize the marketing spend.
You can use these audiences for remarketing, directly. These audiences can be seen under Configure → Audiences tab

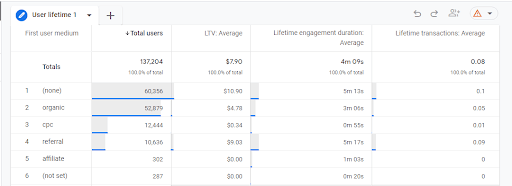
You would also be interested in knowing what is the Customer Lifetime Value (CLV). User lifetime is a technique used to show how a user behaved on the website during his engagement period. Through eCommerce reporting, you can find insights like
- Source/medium of users who contributed to the highest revenue
- Active campaigns that brought more high-intent users in to make any adjustments in the campaign or run a new one on this segment
- User insights like when a user was last engaged/purchased on app/site
Conclusion:
Google Analytics 4 lacks some standard eCommerce reports available in Universal Analytics. But, the built-in techniques available in the ‘Explore’ section come with more flexibility in measuring users’ journeys across various dimensions. It uses its predictive learning capabilities and machine learning to give you in-depth insights into the high-intent users eventually improving your Conversion Rate.
While Enhanced eCommerce for GA4 is constantly evolving, there is a rollout of a few basic reports but some advanced capabilities that users can start exploring for their business today.
Here’s a sneak peek of how eCommerce reporting in Google Analytics 4 is here to transform your overall business strategies and customer experience.
