If you are in B2B business the best way to check the performance of your site is to check how many leads it generates. But it is not at all easy for any lead gen sites to convert visitors in to leads and get business. To attract more visitors and generate potential leads you invest heavily in the appearance of your website, hire best developers and use best web site technologies. And still, you find that you are not generating enough leads to grow your business. Its because sometimes business owners ignore one very important part of the web site, which is lead gen forms. Lead gen forms are one of the prime way to grow your business. That’s why as a B2B site owner, it is imperative to check the performance of the lead gen forms.
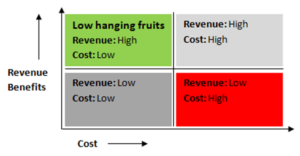
Another reason why it is advisable to check the performance of forms and fix the issues is that leads gen forms are ‘Low hanging fruits’ for the business. ‘Low hanging fruits’ are those opportunities for business where you achieve high ROI without incurring much cost. Lead gens forms belong to this category due to the impact it can cause on the revenue. Benefits derived from optimization of forms can yield great financial benefits to the business as it can directly impact the no. of leads submitted. But question is how to check the performance of the forms using form field analysis.
In this blog post i am sharing with you one interesting case study of the lead gen forms’ analysis that we have carried out for one of our client. I will now try to to lay down the road map in a simple and systematic manner so that it will become easier to understand and execute as well. I hope that this blog post will give you a clear idea on how to check the performance of your lead gen forms.
Objective of the analysis
Our objective behind carrying out this analysis is to identify if there are any anomalies in forms fields or forms positioning that is leading to extra-ordinary drop-off rate during the form filling process. Along with it we also want to understand whether it is required to restructure the order of certain set of forms to have them understandable & easy to navigate to ensure higher form fill up rate.
Data collection/Methodology
To carry out any analysis it is utmost important to gather right data. It was not possible for us to get the data required to carry out this analysis in GA so we implemented advanced tracking mechanism to track all the necessary data points. Implementation of tracking was easier for us as we already had GTM implemented on the client’s site. GTM made all the tagging easier. If you wish to carry out this analysis after reading this blog post, I would strongly suggest you to implement GTM as it will make your dev. team’s life much smoother. (Here is a blog post on why I love GTM)
Now, since GTM was implemented, we customized JavaScript to track different steps (fields of forms) using virtual page views in Google Analytics. Virtual Pageviews get fired whenever user completes any field and moves to the next field or perform any other action. This implementation ensures that we track the interaction of user with each form field.
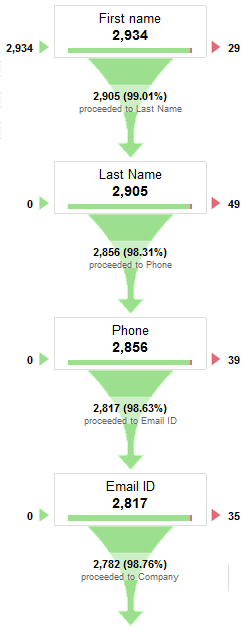
Using virtual page views, we built different funnels for each form to learn the number of users starting the funnel & understanding users’ abandonment at different forms fields. We created funnel goal for each form and ensured that funnel steps match the sequence of fields in the form. It ensures that we track the user flow from the first field of the form to form submission. One example of such funnel is shown here. This funnel shows the no. of users abandoned the form from each field. In this figure, the steps of the funnel describes the name of the form fields and no. on the RHS describes no. of users who abandoned the form from each field.
We also collected data of form positioning on different pages, no. of fields in forms, no. of errors occurring while filling the form, no. of visits distracted towards form sidebar links.
At the page level we considered Pageviews, Avg. page load time, avg. time on page and exit rate as primary set of dimensions and metrics which give us clear idea on the form pages.
So this was about what data points needs to be collected to carry out this analysis. I have divided this blog post in to two parts. In the second part, I will explain about how we carried out data analysis and set of action items that has generated from this analysis.


