Empowering Data-Driven Excellence with Tatvic's Looker BI Services
Tatvic, India’s first Looker BI reseller, empowers your business with the platform’s immense capabilities and elevates your data analytics ecosystem to drive business growth!
Why Choose Tatvic's Looker BI Services?
Harness the full potential of your data with our comprehensive suite of Looker BI solutions. From implementation to optimization, we are your partners in transforming raw data into actionable insights that drive business success.

Assured
Data Governance
Looker BI provides insights as well as offers robust data governance capabilities. With advanced access controls and security measures, Looker ensures that your data remains accurate, reliable, and compliant with regulations.

Enhanced Data Interoperability
Looker BI stands as a bridge between disparate data sources, facilitating seamless data interoperability. It brings together data from various systems, databases, and platforms, allowing a comprehensive picture of operations.

Automation-driven Activations
We leverage Looker BI’s easy and automated activation to start deriving value from your data sooner, eliminating unnecessary complexities and accelerating your journey towards data-driven decision-making.
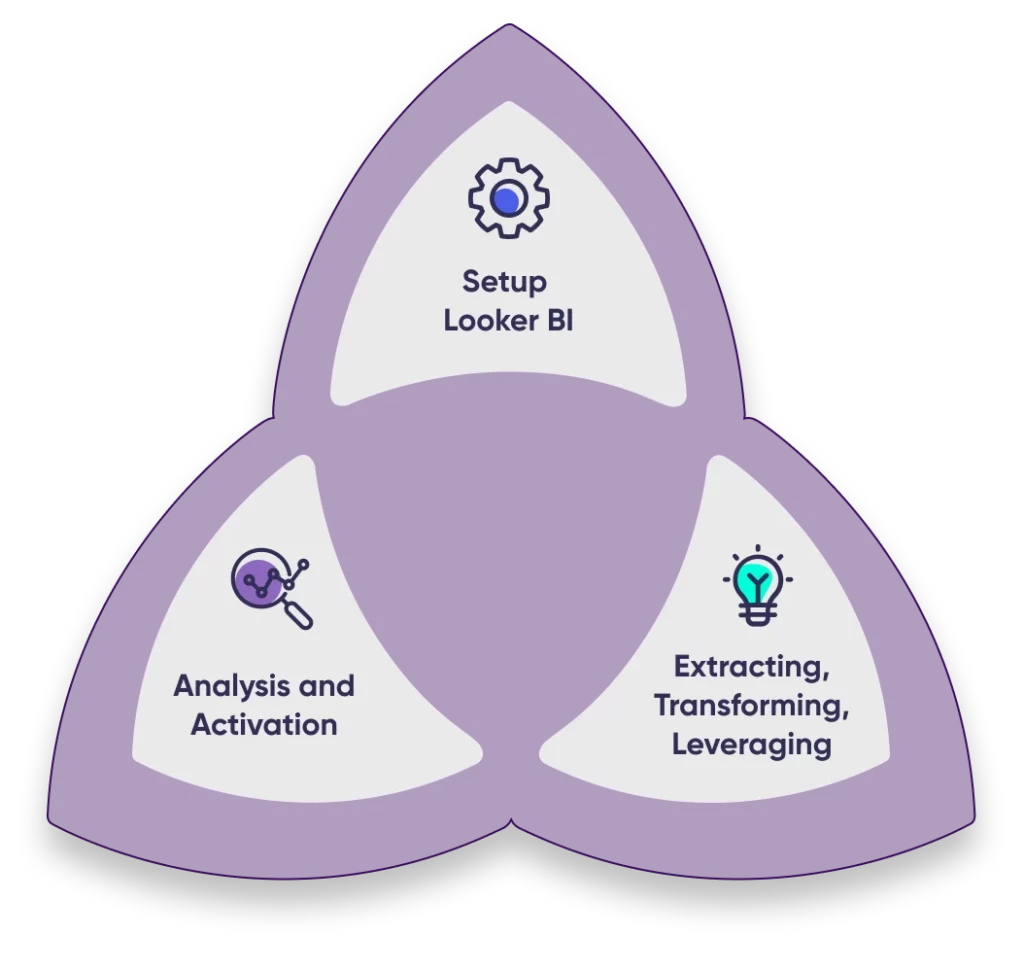
How do our Looker BI Services work?
Our seamless Looker BI Process ensures that your investment in Looker BI yields not only exceptional business intelligence but also tangible and meaningful value across various dimensions.
- Seamless integration of cloud data platforms to collect data efficiently
- Simplified access of data from various sources and BI Platforms
- Extracting from multiple sources
- Transforming raw data into a robust database
- Leveraging SQL-based LookML
- Leveraging Looker’s pre-defined and Tatvic’s customized data analysis models.
- Comprehensive visualization of analyzed data through reports.
- Automated Activation across multiple platforms for faster operations.
Tatvic's Looker BI Offerings
When it comes to Looker BI, our services aim to help customers access the platform’s multidimensional capabilities when it comes to utilizing the power of Data Analytics to drive business growth!
Seamless Integration
Tatvic helps you experience a smooth integration of Looker BI into your existing systems and data sources. Our skilled team ensures that Looker becomes an integral part of your data landscape, facilitating a cohesive data analytics process.
Data Visualization
Our goal is to make data understandable and accessible. Tatvic’s Looker BI Experts create user-friendly dashboards with in-built alerts that present your data in clear visual formats, making it easier for your team to grasp and act upon insights on time.
Advanced Data Modelling
Dive into the world of advanced analytics with Looker BI. We help you unlock the potential of predictive analytics and Machine Learning-driven Data Modeling, enabling you to uncover patterns and trends that drive better decision-making.
Embedded Analytics
We leverage Looker BI’s embedded analytics and custom application capabilities, enabling organizations to integrate analytics directly into their own applications, portals, or websites and improve customer experience.
Ready to embark on a data-driven journey?
Contact us today to learn more about how we can align Looker BI with your unique business objectives.
- Leverage your data to generate actionable insights
- Improve Customer Experiences with Looker BI's Embedded Analytics
- Achieve comprehensive Data Governance and Access Management.
Leveraging Looker BI For Wide-Ranging Businesses
When it comes to Looker BI, our services aim to help customers access the platform’s multidimensional capabilities when it comes to utilizing the power of Data Analytics to drive business growth!
eCommerce
- rack eCommerce KPIs, such as revenue and conversion rates.
- Use predictive modeling to optimize sales performance.
- Manage categories and inventory efficiently with Looker analytics.
- Understand customer behavior with profiles and purchase patterns.
BFSI
- Real-time Financial Insights to monitor key performance metrics
- Customized visualizations for different stakeholders
- Predictive Analytics for Forecasting
- Understand customer behavior with profiles and purchase patterns.
- Call center analytics to gauge customer behavior
Media/Publishers:
- Looker BI creates scalable dashboards for comprehensive insights
- Provides insights on content, ad performance, and authors’ contributions
- Tracks channel influence for informed decision-makin.
Retail:
- Real-Time inventory insights to optimize stock management
- Customer Analytics To analyze customer behavior and preferences
- Demand Forecasting through advanced analytics and historical data analysis
- Store Performance Tracking using metrics such as sales and foot traffic.
FAQ's
Looker BI is not just a tool; it’s a catalyst for transformation. Looker is a cloud-based business intelligence and data analytics platform designed to empower businesses with data-driven decision-making. It allows organizations to connect to various data sources, centralize their data, and create interactive and customizable dashboards and reports.
Looker places a strong emphasis on data security. It offers features like role-based access control, data encryption, and auditing to protect your data. Additionally, Looker is compliant with various industry standards and regulations, such as GDPR and HIPAA.
Looker BI can connect to a wide range of data sources, including relational databases, cloud data warehouses, web services, and more. It also offers integrations with popular data storage and analysis platforms such as Amazon Redshift, Google BigQuery, and Snowflake.
Yes, Looker is designed to seamlessly integrate with a wide range of data sources and systems, ensuring a cohesive data analytics experience. Further, Team Tatvic also offers comprehensive training sessions to ensure your team is proficient in using Looker for data analysis.
