
Businesses constantly look to optimize their advertising campaigns as they are heavily banking on digital marketing platforms for revenue impact. The data-driven attribution model is key to the game plan. What’s working, What’s impacting the bottom lines? Which channels/touchpoints are contributing to conversions? It is an always-on discussion in the marketing war rooms.
Google Analytics, one of the largest used tools for data and analysis, is the source of understanding and leveraging ‘Attribution’. Historically, the “Last non-Direct click” attribution model core to Universal Analytics leads to a large redistribution of traffic into other channels that may have actually come back via Direct as a result of a “last interaction” model. That’s where Google Analytics 4, the new ML-based tool is helping out with its enhanced attribution model – ‘Cross-channel Data-driven Attribution.’
Universal Analytics 360 is based on the last non-direct click attribution model by default. It provides an option to choose different models temporarily within multi-channel funnel reports but it’s limited to those sets of reports. On the other side, GA4’s default model is data-driven attribution but it also provides an enhanced feature where you can change the model from Property Settings. This will ensure deeper and actionable insights since all your conversions and revenue reports will be based on the same model most appropriate for your business.
As Google evolves its analytics tool, you should understand how the transition from last-click interaction attribution to data-driven attribution will impact the performance statistics associated with your website or app.
What is Data-driven attribution?
Data-driven attribution uses an algorithmic machine learning model to assign credit through the customer journey and evaluate both converting and non-converting paths. With Data-driven attribution, businesses receive more actionable information about their marketing campaigns; giving a broader view of which channels are contributing to the conversions.
This helps marketers make better decisions around where to invest their resources and improve campaign performance throughout the funnel.
The algorithm of how data-driven attribution works is still a black box, but, it is still likely a better option to understand the impact of multiple touchpoints in the user journey. Hence, It is the most preferable model If you’re looking to measure impact across multiple channels.
Previously, using DDA was possible only in GA 360 properties with a certain set of limitations which is not the case anymore and you can now practically use it in the standard version of GA4 as well. In fact, as mentioned earlier, it’s the default model.
How Data-driven attribution affects Reporting in GA4?
Changing the attribution model in GA4 will apply to both historical and future data. There are two key reports in GA4 when getting started with DDA. The first one is the Model Comparison report which allows you to compare different attribution models in GA4.
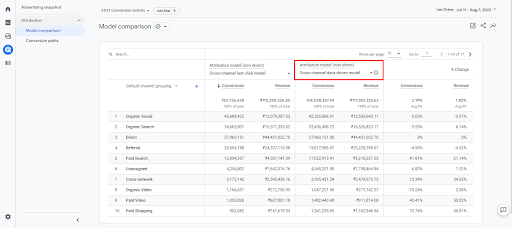
As seen in the above screenshot, with the Cross-channel last click model, the revenue generated by Paid Search is 4.3 million while it is 5.2 million in the case of the Data-driven model. The last click model ignores direct traffic and attributes 100% of the conversion value to the last channel that the customer clicked through before converting. Data-driven attribution, on the other hand, analyzes the available path data to develop conversion rate models for each of your conversion events
The second report is the Conversion Path report which provides a visualization of early, mid, and late touchpoints, depicting the user journey. The data visualization at the top of the report displays data as calculated by the Cross-channel Data-driven attribution model. You can use the attribution model drop-down to view the data visualization using a different attribution model.
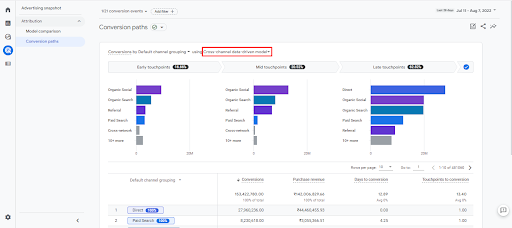
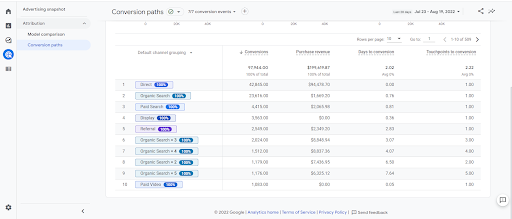
This report mainly has two sections: the data visualization and the data table. The data visualization helps you quickly see which channels initiate, assist, and close conversions. The data table shows you the paths users take to complete conversions, along with the following metrics: Conversions, Purchase revenue, Days to conversion, and Touchpoints to conversion.
Why Data-driven attribution?
Let’s start off with an example scenario. Say you’re a brand that sells T-shirts and John is a prospective customer looking to buy a new T-shirt.
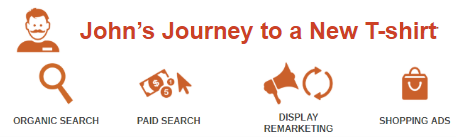
- He searches on Google for “T-shirts” and lands on your website.
- He then starts searching further and views some products on your website from a google ad.
- He still doesn’t decide on what to buy but sees some display ads that remind him that he needs to buy a T-shirt.
- He later searches for the exact T-shirt he saw in one of the ads, clicks on your shopping ad, and purchases the same.
The question is, what channel or campaign gets credit for the same?
Deep diving into how other attribution models will assign credit for John’s purchase will help us understand how data-driven attribution gives true weightage to all your channels in the user journey.
| Cross-channel attribution models | ||||||
| Default Channel Grouping | Last Click | First Click | Linear | Position-based | Time Decay | Data-driven attribution |
| Organic Search | – | 100% | 25% | 40% | 10% | 20% |
| Paid Search | – | – | 25% | 10% | 15% | 15% |
| Display | – | – | 25% | 10% | 25% | 35% |
| Paid Shopping | 100% | – | 25% | 40% | 50% | 30% |
The figures are used here as an example only.
Prepare for the Future with Data-driven attribution in GA4
Google’s data-driven attribution model has the potential to revolutionize how we measure marketing effectiveness. It promises to help digital marketers make more accurate decisions about where to allocate their resources. Its unique features provide businesses with an edge by giving them a more accurate view of how their marketing efforts impact their bottom line.
If you have still not adopted it, now is the time to start planning for Google Analytics 4.
With its powerful Data-Driven Attribution model, you can take your marketing to the next level and gain a more accurate understanding of the role played by various touchpoints to promote conversions for your business.
