

User behaviour is drastically different on mobile apps as compared to websites. This change needs to be reflected and tracked in your analytics tool too. Have you ever faced difficulty answering the following questions while analyzing the app data?
- Is the app interactive enough to keep users engaged and convert effortlessly?
- Is it possible to target audiences based on their behavioural aspects and past activities in mobile apps?
- What are the factors that lead to an app being uninstalled frequently?
- What is the best time to launch new app updates, or run relevant marketing campaigns?
To understand your mobile app users and their behaviour, Google Analytics has introduced a platform for app analytics. It is called Google Analytics for Firebase and it is a one-stop solution for app implementation and tracking activities. It’s a one-for-all tool that can be leveraged by app developers, marketers and product managers. In Firebase Analytics, data is collected in terms of events and users as opposed to sessions and screenviews like in Google Analytics. This enables product managers to analyze user actions while using their apps.
In this post, I am going to walk you through some insightful analytical features of Google Analytics for Firebase. The aim is to help you analyse the user behaviour and enhance your app experience based on the insights generated from each of them.
Feature 1:
Event-based funnel analysis
Firebase Analytics has a default report called Funnels. This report helps us understand the systematic actions taken by app users on a generic basis. It touches upon different points in their journey to complete a series of events including where they drop off in the particular process. These are open funnels, which means that users need not have completed the previous step in order to be included in the metrics for a subsequent step.
Setting up these funnels is a simple process. All you require is the basic Firebase event tracking implemented in your app. Once that is done, you need to add a series of events as steps to a particular funnel, in the sequence you wish to analyze.
Insights & Takeaways
- Funnel analysis in Firebase Analytics can deliver insights on changes in user actions i.e. features depicted in the funnels report. The report indicates the step at which maximum users drop off. This helps you to make the necessary changes & optimize your user’s app experience.
-
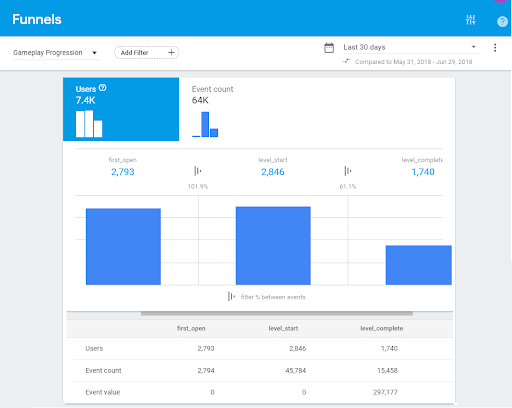
- For Example: Let us take a look at the following report on a gaming app. It shows the total users at a particular step and the ones that moved to the next step:

- In the above report, level_start indicates the start of a game.
- The report considers all those users who opened the app as soon as it was installed. And it goes on to see whether they started using the game right away or refrained from playing the game consistently.

- Now from the report, almost 67% of users are retrying a level before they can complete it.
- In such scenarios, you can run A/B tests on such segments to help them reach the next level of the game. You can do so by switching their current level into an easier one to play on if the retrial count exceeds a certain number. This will keep them engaged in the app and encourage them to continue using your app.
- For Example: Let us take a look at the following report on a gaming app. It shows the total users at a particular step and the ones that moved to the next step:
-
Feature 2:
App uninstall analysis
Firebase provides a set of default events that are tracked automatically, whenever any user performs actions corresponding to those events. App uninstall is one such event that makes
Firebase Analytics is a unique app analytics tool. App Uninstall event app_removal is available in reports without any explicit implementation.
Insights & Takeaways
- You can use this event report to understand the behaviour of your users who tend to uninstall the app after performing a certain set of actions.
- Moreover, you can also build a funnel of all the important actions in your app, with the app_remove event being the last step. This will enable you to get details about a particular set of events that might have led users to uninstall the app.
- Based on these insights the product managers can work on improving the user experience by either providing them with a different set of features or by enhancing the existing look and feel of the app.
- You can also study the app uninstall events report data collected by Firebase by filtering it out for the app_remove event, and get insights like their geographical location, demographics data, etc. on a segment of users who already uninstalled the app.

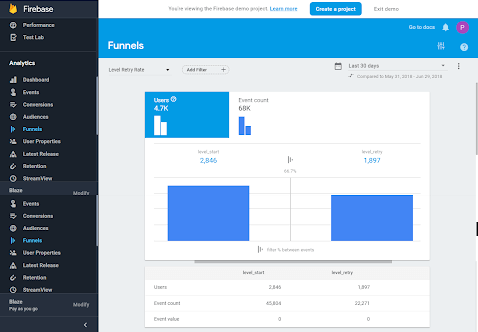
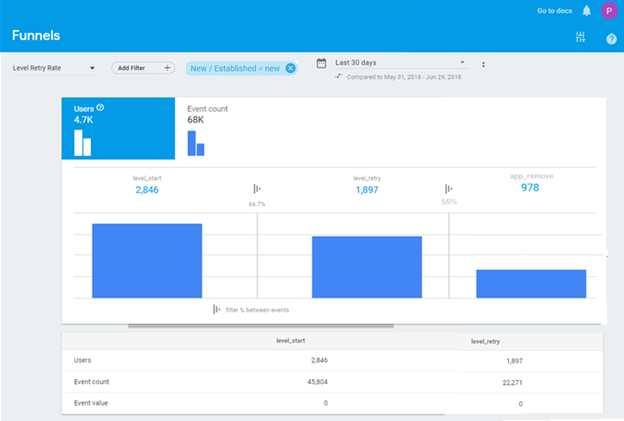
- For Example: The above report is for the same gaming app we saw earlier. This report shows that around 2K users started playing the game, out of which 67% of users re-tried the level out of whom 55% uninstalled the app.
- Applying a filter of ‘new’ users, it can be seen that a lot of new gamers are uninstalling the app as they are not able to move forward in the game. We can personalize the experience for such users, and give them some advantage in the game to keep them engaged with the app.
- Moreover, with an integration that’s possible between Firebase Analytics and Google Ads (AdWords), you can also create an audience segment consisting of these users and remarket to them with some special offers in an attempt to gain them back.
Feature 3:
User Retention Analysis
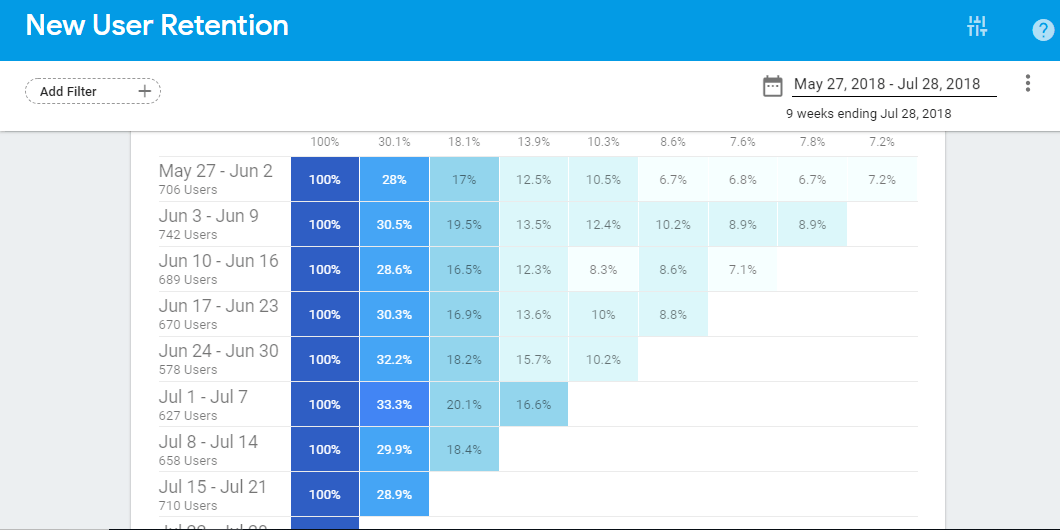
The graph in the User Retention Report shows whether users acquired on a particular date/week continue using the app at a greater rate as compared to users acquired at a different date/ week. The report provides insights into the most suitable time for running any new campaigns for acquiring new users remarketing to existing ones or for releasing any new feature.
Insights & Takeaways
- For example, the following Cohort Report for our gaming app reveals that users acquired between June 3 – June 9 have a higher retention rate after 2 weeks along with an overall higher retention for all weeks as compared to other cohorts.
- Similarly, the users acquired in the week of Jul 1 – Jul 7, have a higher retention rate as compared to other weeks in that month.
- The above insights suggest that the business can target the first week of every month to run more campaigns related to user acquisition.

Bonus Tip: Another option is to track user property like “user acquired” (date when a user was acquired) or “last used” (the last time the user interacted) in your app, and use it as a target for the Notifications feature of Firebase, showing them some offers like maybe some incentive on crossing 5 levels of the game, and so on, to keep them interacting with the app and eventually retain them as customers.
Feature 3:
App Crash Analysis
Firebase Crash Reporting is a lightweight and real-time solution for all app crash-related insights that developers need, to ensure a seamless user experience. It groups all relevant crashes for you and provides details about scenarios that led to the particular crash.
Analysis & Takeaway
- You can rectify the errors shown by Crashlytics, deploy these changes instantly to all users with Firebase, and check its real-time effect through Streamview report in Firebase Analytics Console.
- This saves a lot of troubleshooting time for developers and helps them enhance the app effectively.

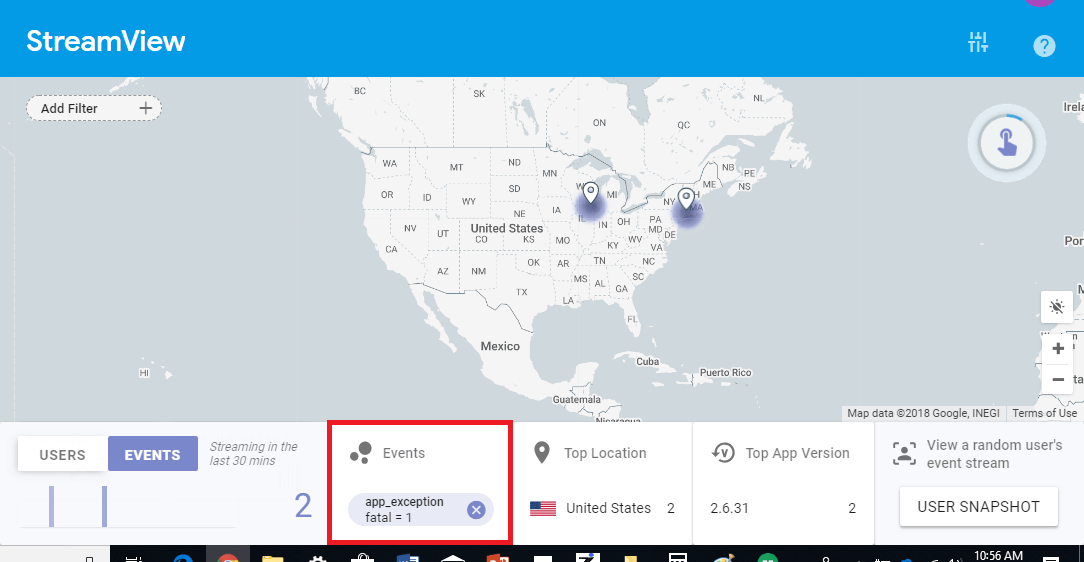
- The above report shows all real-time fatal exceptions i.e. crashes with the help of app_exception event. App_exception is tracked by default in Firebase.
- It suggests that there were 2 app crashes in the last 30 minutes from the United States in the app version 2.6.31.
- You can go to Crashlytics and check the details of these issues, by filtering the report based on the ‘Crashes only’ event.
- Crash Insights feature in Crashlytics report analyzes aggregated crash data for common trends from different apps available in the market. It highlights potential root causes and gives additional context on the problem. You can get details on probable cause, actions that need to be taken and resources to refer to, improving your debugging efficiency.
Conclusion
Firebase Analytics tracks data in terms of users and events very efficiently. It has all the app-specific metrics readily available for analysis. App analytics is tightly integrated with all other functionalities offered by the tool. Also, with a single Firebase Analytics SDK to be implemented, it is easy to personalize/customize the app and target the right audiences for campaigns. Moreover, if you are interested in knowing more about Google Analytics for Firebase, watch this space for my next blog post where I shall talk about a few of the most important features & integrations with other Google products of this app analytics tool.
If there are any analytical points that you perform with the help of Firebase, I would love to hear about them. Tell me about your unique and insightful analysis in the comments section below. I will include the best one in this blog with all the credits where they are due!
