

A high-performing website is the cornerstone of a successful marketing campaign, offering a multitude of benefits that can drive remarkable results. It has the potential to generate a higher return on investment for your advertising spend, elevate brand awareness, and foster trust among your target audience. However, achieving such success requires more than a simple redesign or content revamp; it necessitates comprehensive website optimization beyond surface-level changes.
The ultimate objective of website optimization is to provide your target audience with a user experience that naturally guides them through the conversion funnel, progressing seamlessly from awareness to conversion.
This is precisely where Audience Analysis can help you understand your target audience’s intent and behavior, helping you to frame your website optimization strategy more effectively.
What is Audience Analysis?
Decoding your Audience:
”Understanding your audience through data for a successful CRO program.
 Audience analysis in a CRO program refers to the process of gathering and analyzing data about the target audience to gain insights into their demographics, preferences, behaviors, and needs. It involves studying the characteristics and behavior of your website visitors or users to understand their motivations, pain points, and decision-making processes.
What are effective methods for conducting “Audience Analysis” to achieve website optimization success?
1. Defining the Elements that create value for the Users:
“Users visit your website with the intention of finding a Value”
It is important to identify the elements that truly provide value to your users and understand their engagement. It is vital to align these elements with the goals and objectives that users have when they visit your website. Remember that users browse your website with the intention of gaining value.
These values could be subjective and might change depending on the industry that you represent. Bain and Company have compiled a list of elements that create value for the users looking at specific solutions, industry-wise. These could be useful to set up the expectations for your CRO program.
Let us take an example of the Life Insurance Industry. What are the elements that create value for the users while they are interacting with an Insurance business’ website?
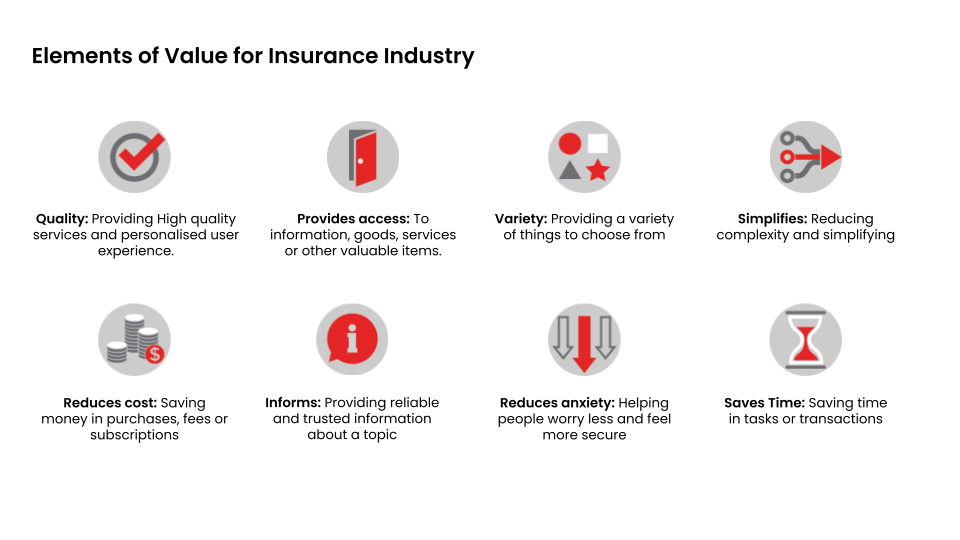
Here, some general conclusions could be:
- Elements like Quality and Variety of insurance plans are important for potential customers.
- It is important that your website provides access to reliable and true information in order to reduce anxiety about purchasing the plan that suits the best for them.
- The process should be simple and time-saving too. All in all, it should be hassle-free!
Lastly, it is important that the users have the incentive to choose your brand over others, be it through competitive prices or other monetary incentives.
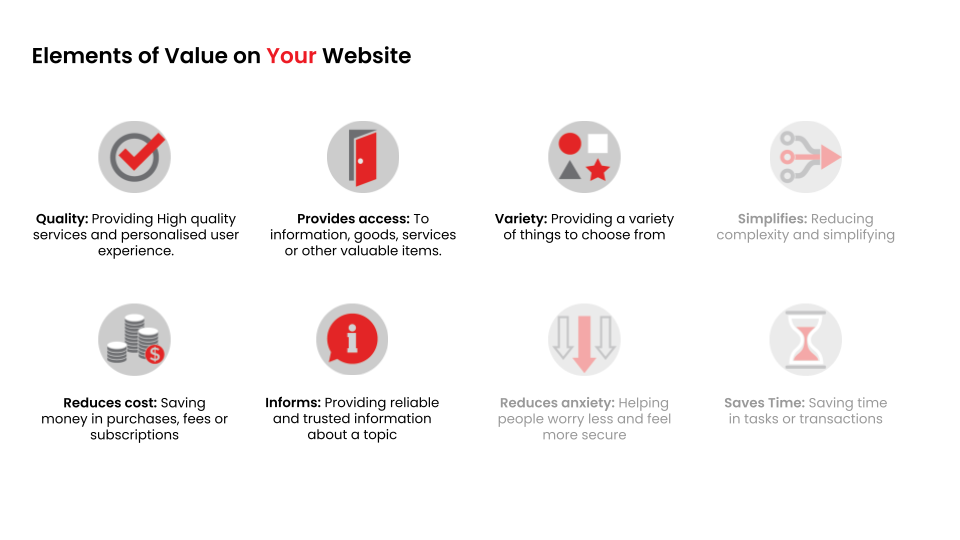
Once we define elements of value for the specific industry, it is important to identify which values are evident on your website and which the ones that are missing.
This approach allows for targeted improvements instead of aimlessly guessing what works and what doesn’t. For instance, if we discover that catalog browsing lacks intuitiveness, we know that enhancing the browsing experience and improving the overall user experience (UX) can guide users through the conversion funnel.
By understanding user expectations and conducting experiments, we can determine the effectiveness of implementing these value-driven elements on your website.
This iterative process not only helps you optimize the user experience but also enables continuous verification and refinement of your website optimization strategy.
2. Decoding Your Traffic:
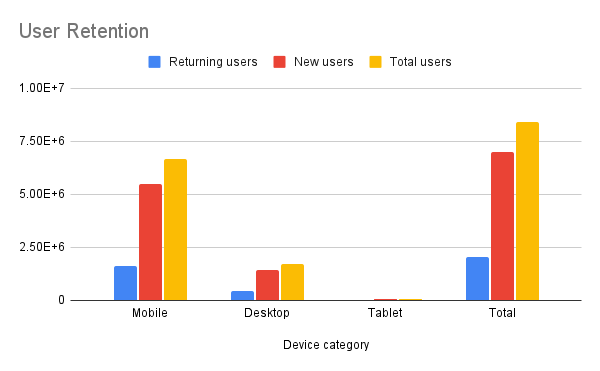
Your website analytics provides valuable insights into the amount of traffic your website receives. However, it’s equally crucial to determine the devices through which users interact with your website: desktop or mobile web versions. This information directly highlights which version requires your immediate attention for optimization. By prioritizing the version that aligns with user preferences, you can enhance the user experience and drive better results.
You can then identify what is the proportion of returning users vs. new users. This will help you understand the retention rate of your website. If you have a higher influx of new users but very few returning users then it can be seen that your website is not able to engage the audience as much as it should, owing to a lower retention rate. This indicates a lack of engagement on your website and a gap in user experience. This could further be analyzed for Mobile users and Desktop users.
Let us take an example to understand how to go about decoding your traffic:
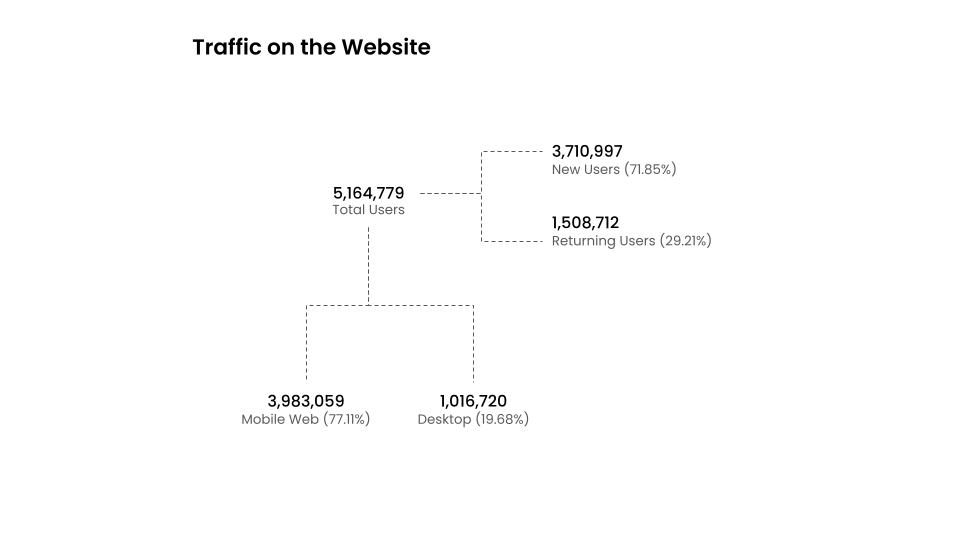
Quick observations from these data points:
- Here we can observe that out of 5.16 million users that visit the website, around 3.98 million (77.11%) users visit the mobile web version.
- It is indicative that working on optimizing the mobile experience would provide better ROI for your conversion optimization efforts.
- It is also observed that the number of new users is significantly higher than the number of returning users for a specific time duration.
- This indicates that the retention rate for the website is lower.
So, even if your website acquisition is powerful and you are burning loads of your money on ad spend, inefficient engagement will lead to higher drop-offs and fewer returning users, stagnating your Returns on Ad Spend (ROAS) and overall Revenue.
Here, the same trend of fewer returning users is observed for Mobile and Desktop devices. This means that both versions of the website require optimization. However, one thing you need to check is: if the users may not be returning to the website but are making a transaction on the first visit then this also creates value for the brand as it indicates that the website is able to prompt the users to make a purchase on the first go (which is usually not the case with most of the websites).
Conversion Rates (CVR) for these different categories of users come into the picture here. If CVR is also lower for these new users, with fewer returning users in the first place, then it is a serious issue of draining potential users and prompt intervention is required for the website.
Consecutively, the next step is to identify Conversion Rates (CVR) for these different segments of users. It is to identify if the potential customers are bleeding out of the system and if you are losing out on the untapped revenue.
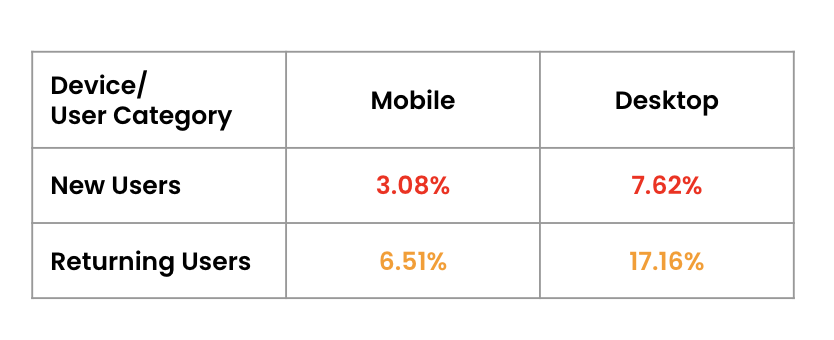
From the CVR data matrix, we can see:
- The Conversion Rate (CVR) for new users is extremely low for both mobile and desktop experiences.
- Most of these users are not returning back to the website, this indicates a huge potential that is missed in this unoptimized user experience.
From earlier insight, we know that the majority of the users are visiting the mobile web version of this website and a relatively lower Conversion Rate indicates that the quadrant that receives the most visitors; New Users on Mobile Web is overlooked and requires urgent action. This too sets a direct pathway towards expectation setting for the CRO Program for this brand.
The Conversion Rate for returning users on mobile is also much lesser than that of the desktop. This concludes that the overall user experience is to be improved for the mobile version.
Next up, we drill down into the acquisition channels for these users. It is important to identify where are the users actually coming from on your website. This is to identify the effectiveness of your marketing efforts or your SEO efforts.
Let us assume that your paid campaigns are giving you off-the-chart impressions but there’s no significant uplift in the number of conversions or overall revenue. Your Return on Ad Spend (ROAS) still remains lower while your Customer Acquisition Cost (CAC) rises rapidly due to all the marketing spending.
This not only reflects on your revenue but also affects the brand image because a huge chunk of visitors to your website choose not to make a transaction and there is a good chance that you might not see them again on your website. So, gauging if your marketing efforts are working in tandem with your website experience becomes important.
Carrying on to the example that we had earlier, if we get the data of the acquisition split for these users for a specific time duration and observe the Conversion Rate then we will get to see how are these different channels performing.
- These are broadly categorized into 3 categories:
- Organic
- Direct
- Paid+Others.
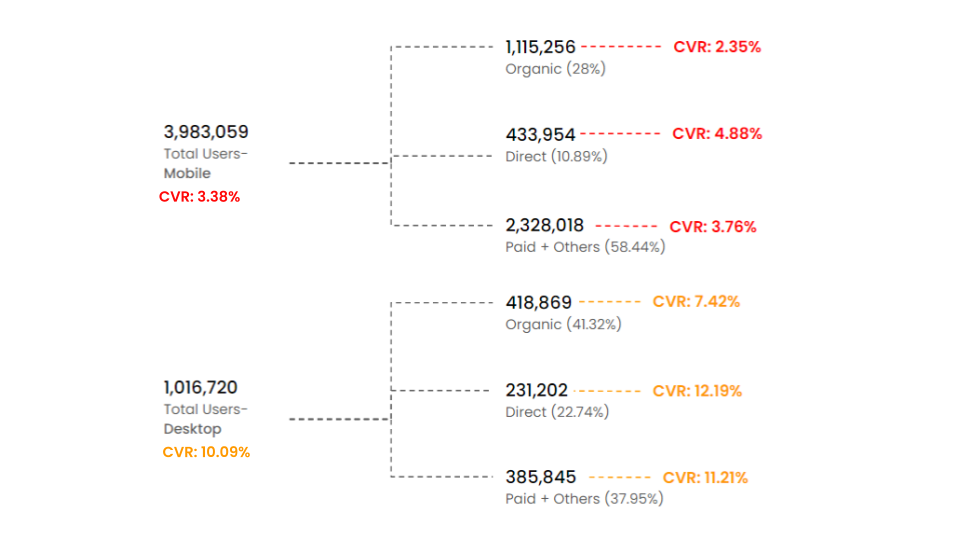
It is broadly observed that the Conversion Rate (CVR) for users coming from the Direct channel is the highest for both the mobile and desktop experiences; it can be speculated from the data that due to brand awareness and pre-association with the brand, Direct users convert better than others.
It can also be concluded that the intent for Direct users is higher on this website and, hence, providing them with a customized, tailored-for-them experience would create value for them and would lead to better conversions.
Next up, Conversion Rate (CVR) for organic users is pretty low for this website compared to the higher traffic it receives. Higher organic traffic reflects higher brand awareness, effective Search Engine Optimization (SEO), better Search Engine Results Page (SERP) rankings, and more relatable content. Now it becomes important to cater to this audience because the intent of these users is also higher to obtain a solution for their pain points. They have put in effort to search for the solution you offer and have then come to your website. So, for organic users, solution-oriented targeting could be more helpful.
Lastly, the segment that you spent the most money on for acquisition- Paid Traffic. From the data, it is seen that the Conversion Rate (CVR) for the paid traffic is intermediate between organic and direct traffic. However, to increase the Conversion Rate for this traffic is quite necessary to increase ROAS vis-à-vis the revenue. So, defining content and design strategy in a way that targets this audience also becomes important.
From this exercise, we can drill down about users coming from which channels convert better and what all strategies can be adopted in order to increase the conversions for different channels where gaps are observed. This will also help you understand how to distribute your money: whether in Ad Spends, SEO, or personalization efforts. Conclusively, this will set a pathway for your business narrative on the website and content strategy for the website.
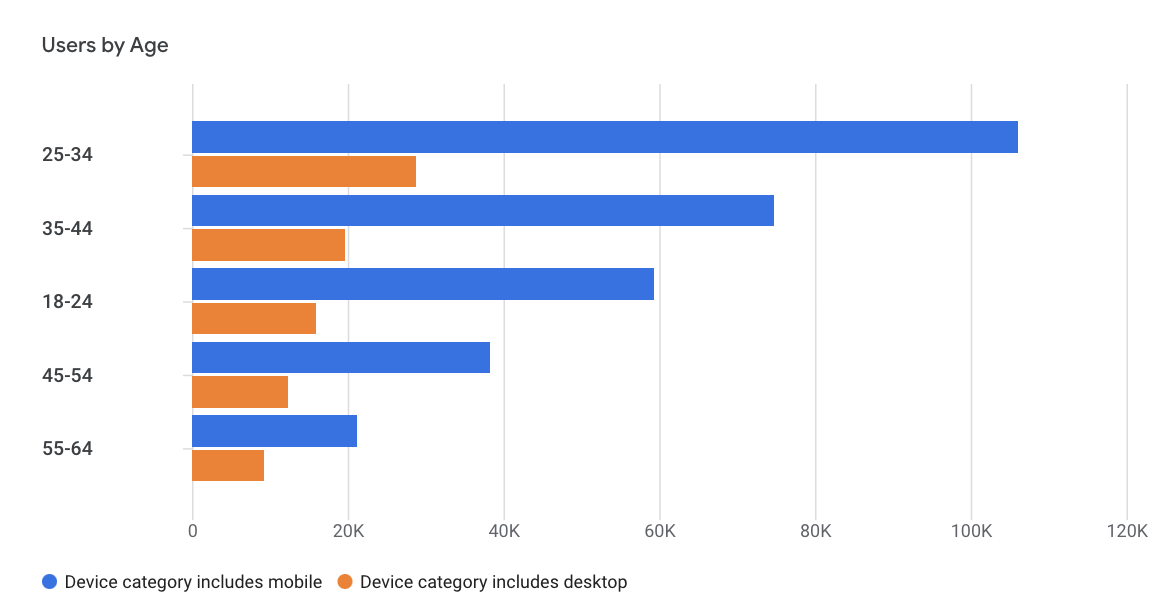
3. Understanding User Demographics
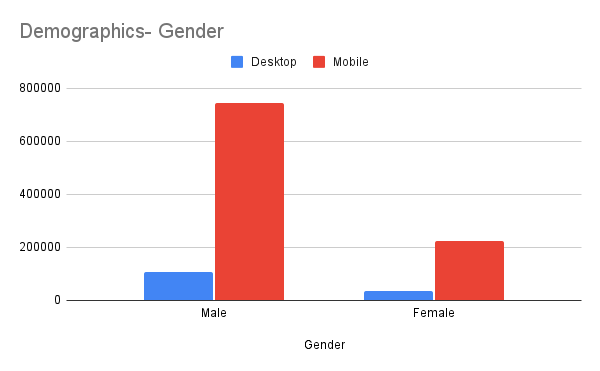
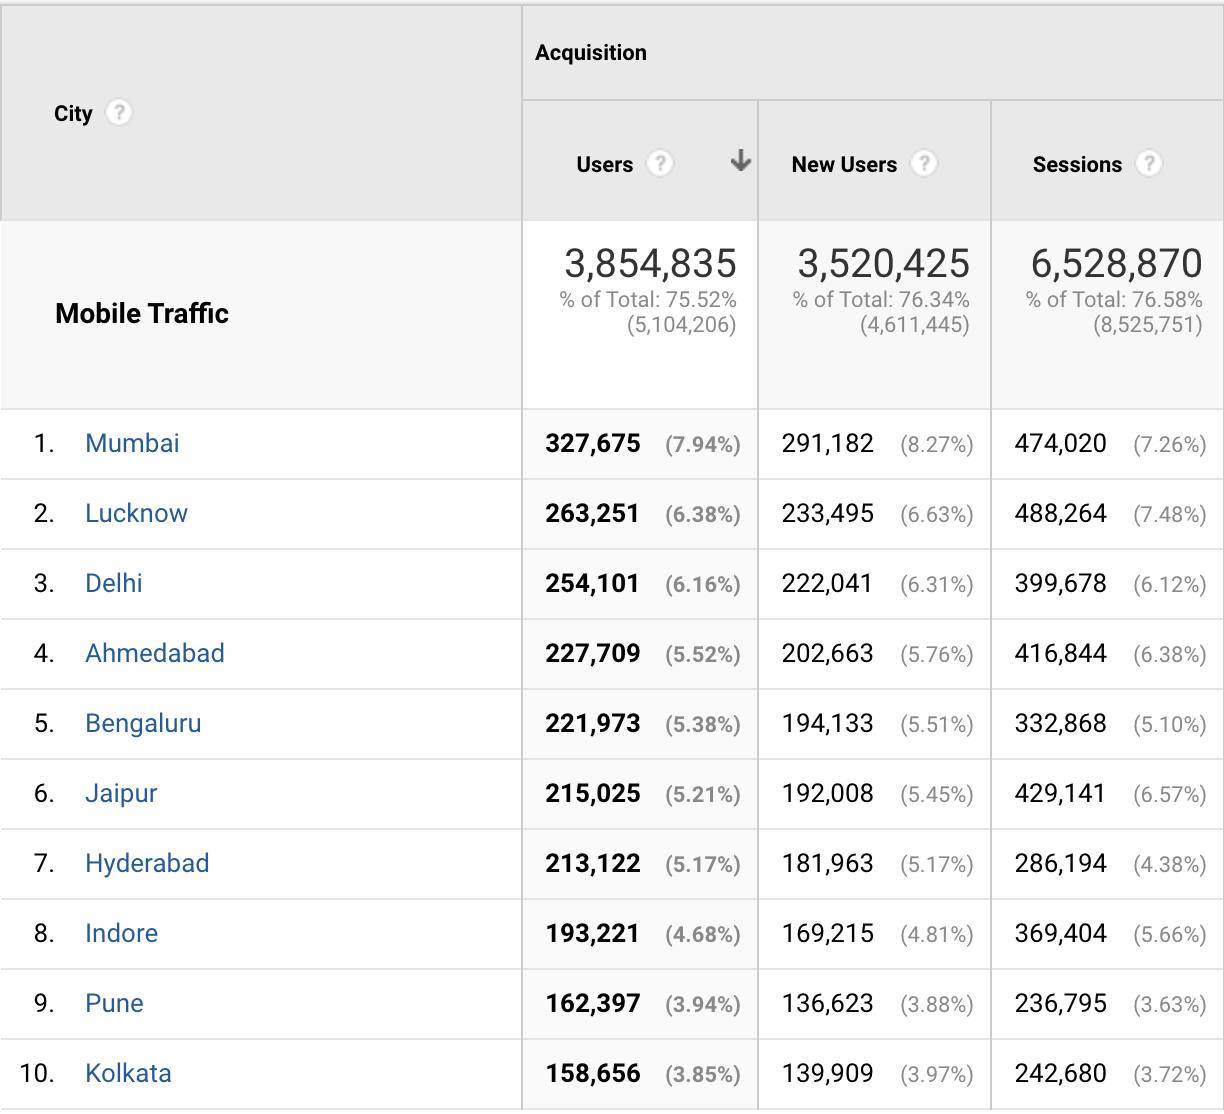
Other important metrics to observe while conducting your audience analysis are the demographic details of your visitors. It is to answer the questions: who are the users that come to your website? What are the top locations from where they are accessing your website? Answers to these questions will help you create an ideal persona for the user that visits your website.
This is a crucial exercise because to customize or personalize the website experience for your audience, you ought to know them! Learnings from these data points help you understand user interaction on your website on a more granular level.
For instance, here in the figure, we can see that more male users are visiting the website than female users. The majority of the visitors are between the age group of 25-34 years. The highest traffic comes from the city of Mumbai in India. So, my ideal user in this case is the one that falls into all these categories. While other user segments are also important, this ideal user is the one for whom you should customize your website.
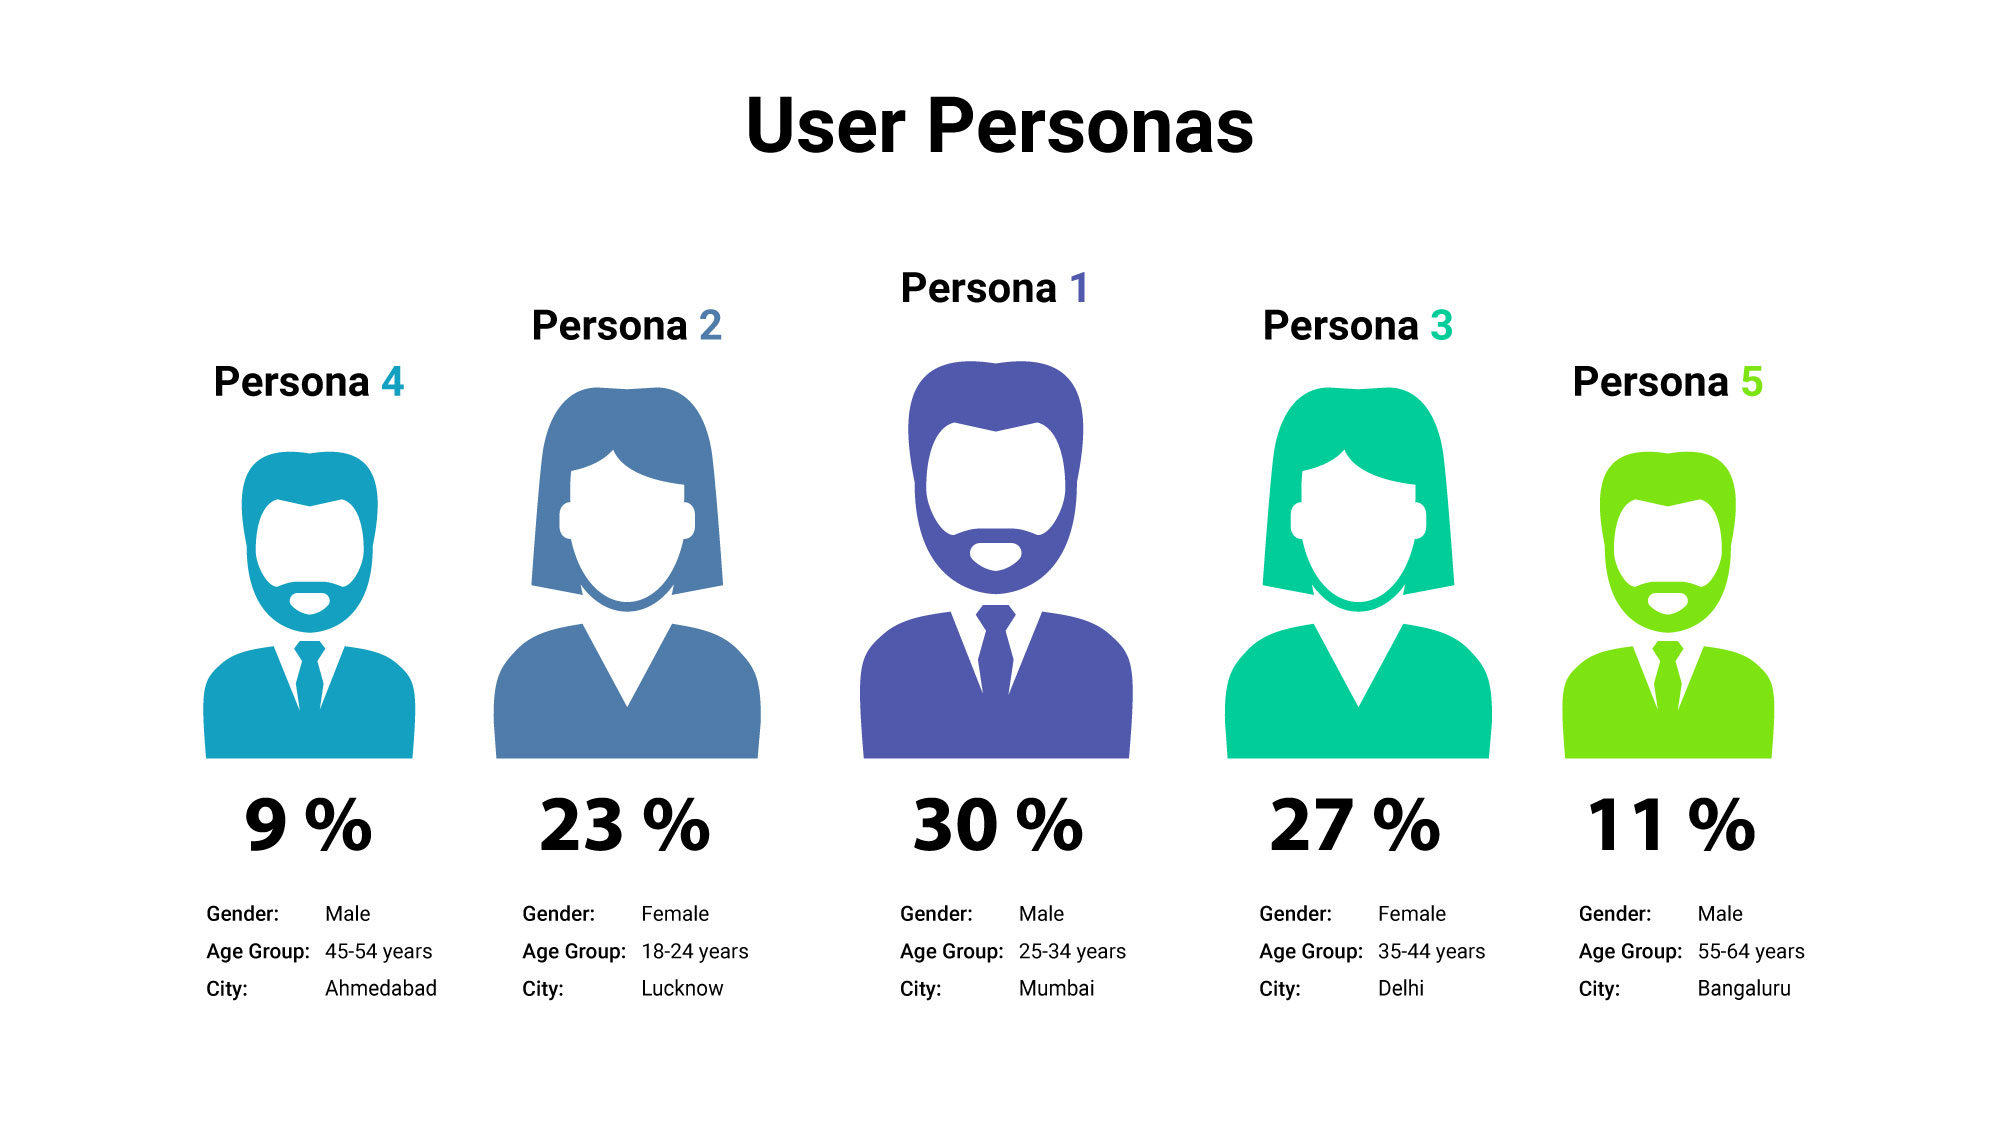
Creating user personas to target the majority of your audience is an important and mandatory exercise to optimize the user experience on your website and; at the same time, to also build and expand your brand.
This will tell you the exact users that interact with your business website and, hence, a better understanding of your potential customers.
Here is a sample of user personas that might help you get started. It has a much more detailed outlook than represented here including the personal attributes of the users and more but to get afoot into the exercise this should suffice too.
What tools, methodologies, and techniques can be used for audience analysis?
The data you need to analyze the dimensions and metrics mentioned above for your audience analysis would be available in your analytics software embedded in your website such as Google Analytics, Adobe Analytics, or any other. If there is no analytics software embedded in your website then I highly recommend that you do that on priority to optimize your business today. Tatvic has a Google Analytics offering, I would recommend checking it out to understand your business better! Connect with us to begin tracking your website data.
Additionally, to get a better insight into the user behavior of these users you can use tools like Hotjar, Microsoft Clarity, Crazy Egg, and others to get mouse tracking data or for heatmaps and scroll maps. This will also inform you about your page performance.
User testing and direct or indirect feedback could also be beneficial in analyzing your website behavior. If you have the budget then I would recommend conducting User Testing in multiple phases for different sections of the website so as to get first-hand feedback on the user experience on your website. This could be done through simple tools like Google Forms and Google Meet or Zoom, etc. There are also advanced tools available but then again it depends on the amount of capital you wish to spend and your budget.
User surveys and polls on your website could also be powerful ways to get raw insights about what people think of the user experience of your website. Not all visitors to your website will fill out these surveys or polls but, then again, these are cheaper alternatives to User Testing and could give you rich insights. APIs or online add-ons are available in the market at cheaper rates but you can also hard-code the same from your back-end if you have the bandwidth and resources.
Lastly, you can perform user affinity mapping/clustering or keyword analysis to understand user expectations. However, I believe these are too granular insights for a general overview. So, again, these could be performed if you have the bandwidth or resources.
Conclusion:
Through comprehensive audience analysis, you can uncover valuable insights that set the stage for creating a high-performing website that meets the needs of your audience and fosters long-term success.
