
I have been quite interested in machine learning and how the data visualization is expanding using different machine learning languages like R & Octave.
In a recent e-commerce project, one of the needs was to understand how people add & remove product to the cart. The more important question is how often & when the engagement with the site leads to the increase in the cart value.
To understand this we had added to the custom variable which contained cart value that gets fire on each page. That seems like below:
| var _gaq = _gaq || []; | |
| _gaq.push([‘_setCustomVar’, | |
| 2, // This custom var is set to slot #1. Required parameter. | |
| ‘cartvalue’, // The name of the custom variable. Required parameter. | |
| ‘0’, // Sets the value of ‘Cart’ depending on status. Required parameter. | |
| 2 // Sets the scope to page-level. Optional parameter. | |
| ]); |
Above code ensure that a custom variable will fire a call on every page containing value of the shopping cart at a given page.
And we had page depth which is a pseudo indicator of how people progress towards the site.
To understand the relationship between cart value & the page depth, we extracted following data i.e. what is the value of page depth & cart value for different visits.
The data looked like below:
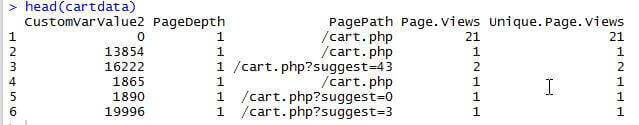
(note: we are using R & ggplot2 to analyse the data)
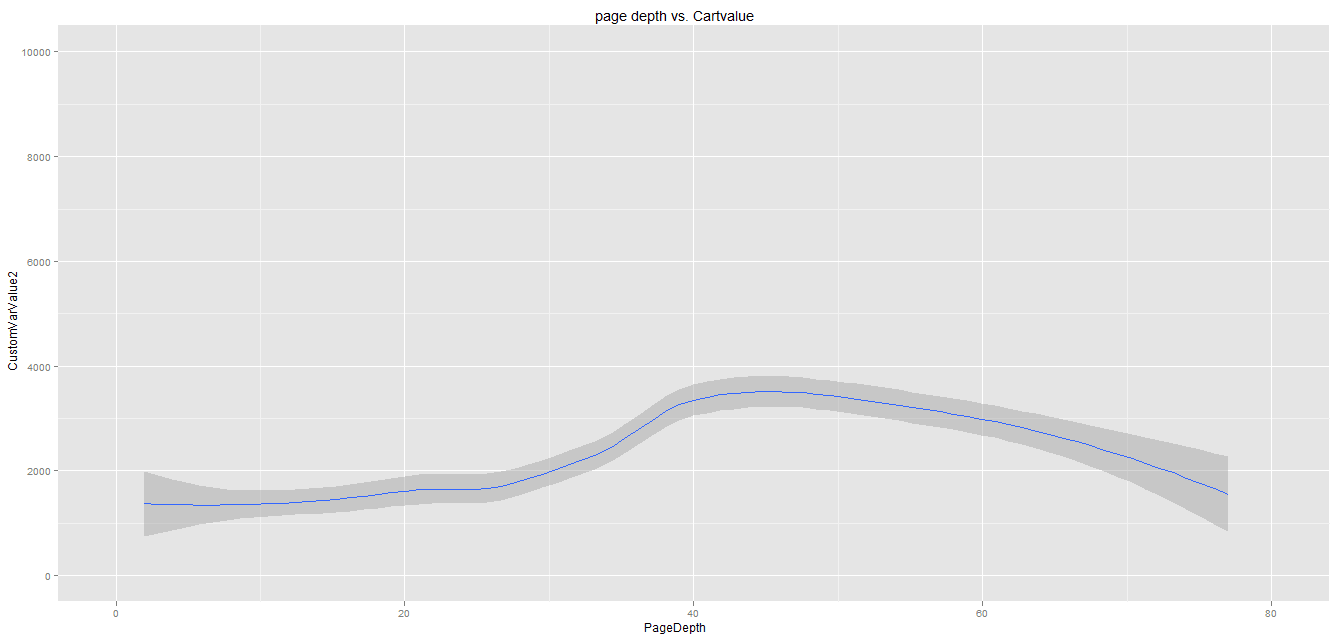
If we plot the chart with page depth as horizontal axis & cart value as verticle axis, It summarizes that after page depth is 20, cart value increases but after 30 till 40, the rate of increases is significantly faster. Also if you notice the brown colored cover around the line is an indicator of variability at that point in axis.
Interestingly when you plot this chart along the actual revenue vs. page depth chart, you start seeing the difference. Addition to the cart is a happening after 20 page depth but that doesn’t seem to be translating to the actual revenue.
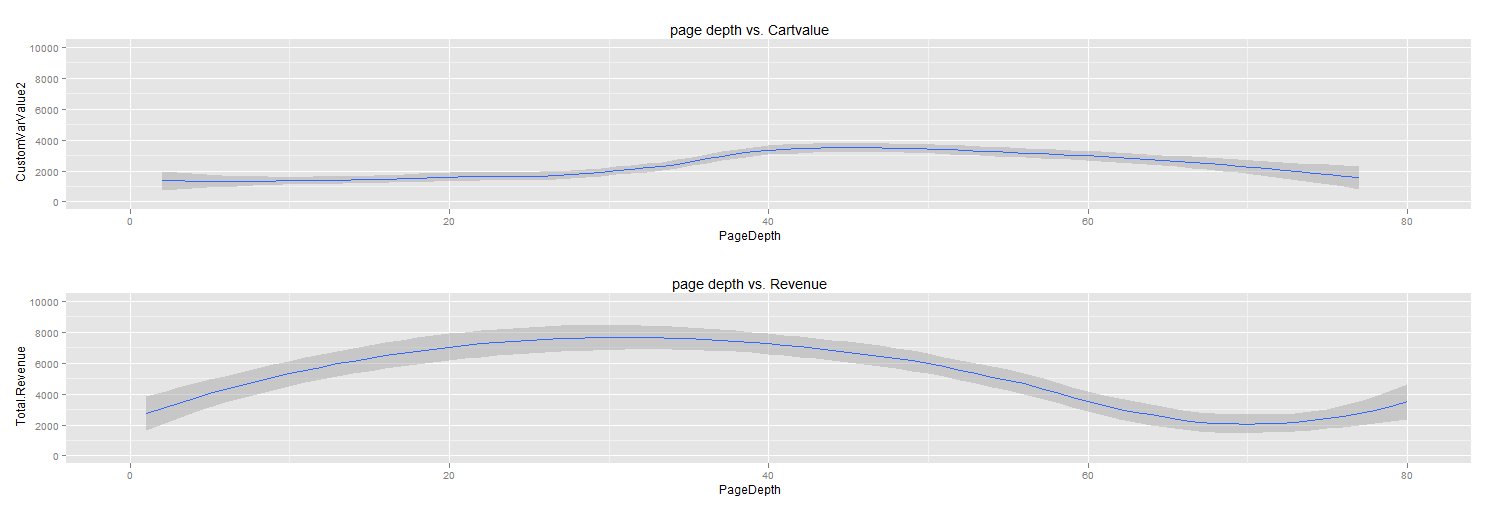
So is it to conclude that lot of products are getting added to cart after specific amount of pages being viewed but that doesn’t get translated into revenue?
I’d differ here as I unearthed more relationship of pagedepth & visits as depicted below:
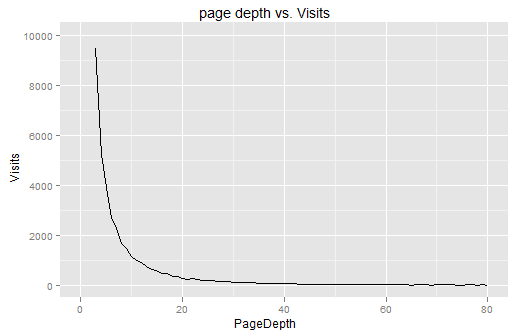
The drop if you see from 5th Page depth to 20th is significant but that is not as fast a drop that you would see in revenue when you do this. This means that the visitors that are between 10-30th page depth are best of your visitors who are great at getting themselves converting from browser to buyer.
