
[vc_row][vc_column][vc_column_text]Set up your measurement tool. Clean and filter your data. Make information from that data. Analyse it. Extract insights from it.
This is some hard work for an eCommerce firm. But to increase the value, there’s another step to be added- the work should be well communicated across the shareholders. You need your data in-line with KPIs to influence business decisions. If you’ve worked in web analytics, you’ve been through the pain of drawing graphs and tables in spreadsheets and once it has been set up, then the process to automate it.
Google Data Studio offers a better depth, that includes easy integrations for the common data sources. This tool offers solutions and better insights into your data.
Data Studio is a part of the vast Google Analytics 360 Suite. It’s Google Marketing Platform’s free business intelligence and data visualisation tool that helps you report and connect from multiple data sources. It’s easy to connect the Data Studio dashboard to get Google Ads spend, traffic on your YouTube channel, and just everything you’ve set up in your Google Analytics account, like goals, segments, traffic sources, etc.
For eCommerce stores and merchants, Data Studio can provide insights on search engine optimization to impact worthy eCommerce metrics. This helps you to track everything from referrers to order values in a single dashboard. These powerful data insights can make a difference in increasing your revenue while selling products online.
How can Data Studio help your eCommerce store?
Data Studio is helpful in getting answers to questions like:
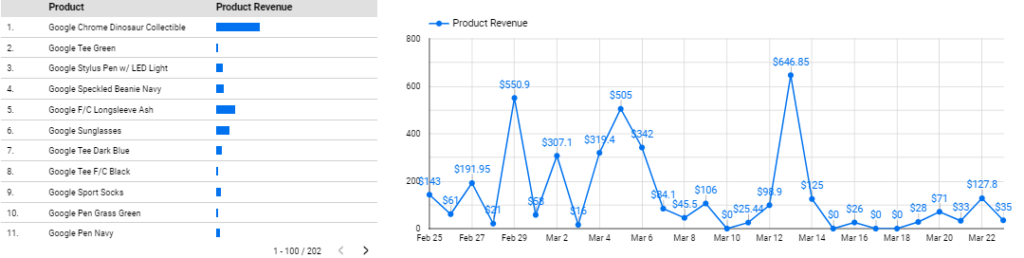
- Which products are generating the highest revenue?
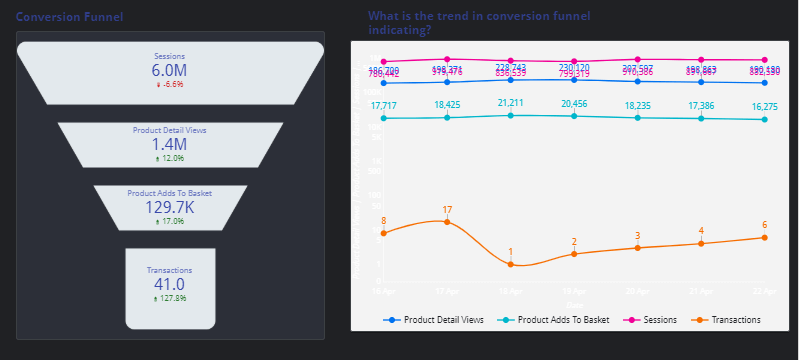
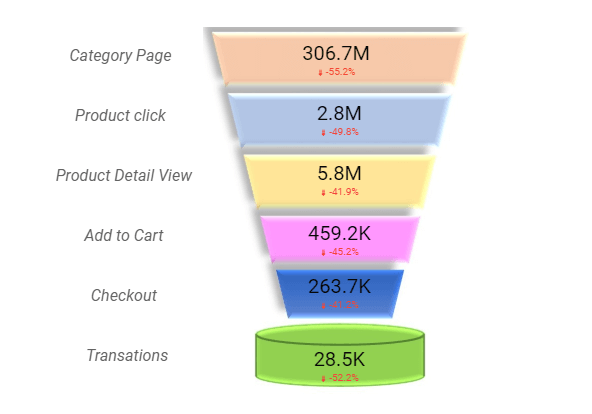
- What is the daily or product-wise trend of add to cart to actual transactions?
- Key metrics analysis for new to returning users
- Category wise product performance
- Which campaigns are performing best in term of revenue generation
- Custom Grouping of Products
- What are the demographics of my highest selling products?
- What is the trend for ARPU on a daily, weekly, monthly basis?
- Compare revenue trends for different product categories
Having these valuable insights can help you understand where your changes and investments can lead you to increase in conversions. For instance, if you see your users abandon carts after they’re prompted to make an account in order to checkout. This will help you to test a guest checkout option. Doing this might help you understand how a simple change can increase your conversion rate and affect your bottom-line, eventually.
This is just one of the instances of how Google Data Studio helps you to bring out your eCommerce analytics data in an easy and interactive dashboard through data visualisation.
Where to Start?
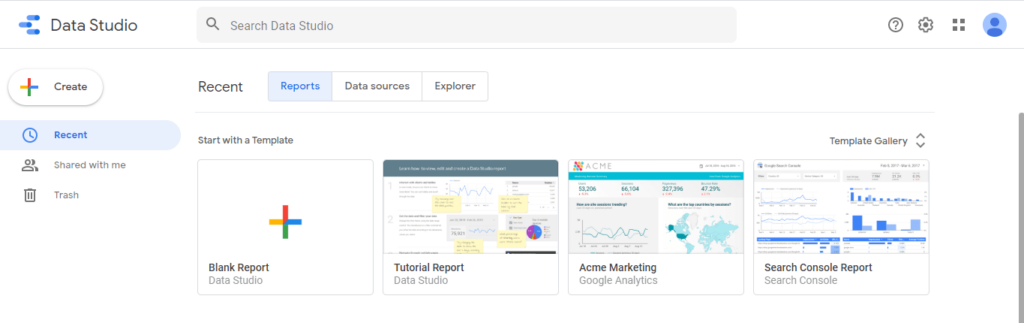
If you’re using Data Studio for the first time, you’ll instantly see a report that gives you a view of the elements in it through an interactive interface. We recommend starting out at the ground level and playing with the tool. The more you use it, the better questions you’ll start to ask. Even if you’re not technical or even a numbers person, Data Studio is an easy to learn tool.
If you’re using Data Studio for the first time, you’ll instantly see a report that gives you a view of the elements in it through an interactive interface. We recommend starting out at the ground level and playing with the tool. The more you use it, the better questions you’ll start to ask. Even if you’re not technical or even a numbers person, Data Studio is an easy to learn tool.
At the start don’t spend all day making a ‘perfect’ dashboard. The dashboard you want right now gives you all the answers you’re seeking. As you continue to move along with your dashboard, you’ll start asking more accurate questions that require better customisations.
Dashboards that analyse data from your sources, built-in templates is the best way to go. You’ll be able to see a PPC eCommerce template, a YouTube report, search console, among others. These templates are a good way to begin with the path of knowing to build a report and understand the connectors that are being used. You’ll start to see how templates combine visualisations and how that dashboard views a result.
Dashboards
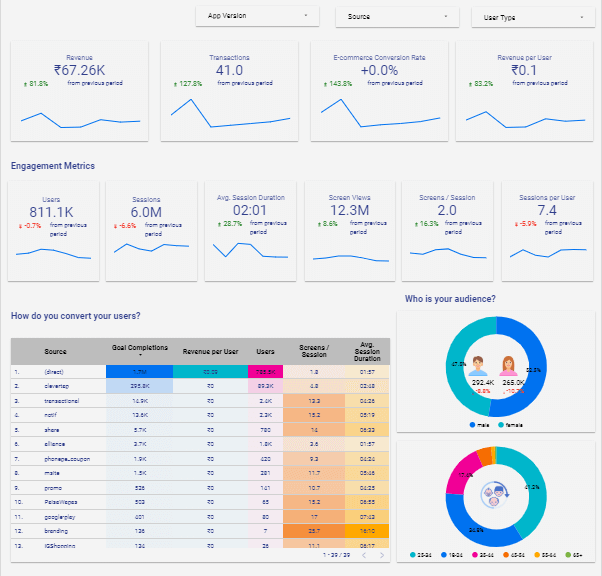
Custom Dashboards in Data Studio are easy to understand and most of all, customisable, giving you the flexibility to make choices to how you present that data – bar graphs, pie charts, and so on. It further makes it easy for you to insert your branding to your dashboard by offering a range of fonts, colors, even adding your company’s logo.
The process of creating an ecommerce report is pretty straightforward, but using the right metrics and the layout is an uphill battle. While some of these things might differ with your business model, there are a few broad metrics and layout that are applicable to all product businesses.
We recommend that you use high-value metrics like
- Conversion Rate
- Cost Per Acquisition
- Revenue per user
- Return on Ad Spend
- Average Order Value
- Checkout Funnel metrics
These metrics will help you understand about your user buying behavior. Analysis of the better performing products you can understand what’s working and what’s not. You can always apply certain techniques to underperforming products to improve their selling rates.
Your Layout
Making the right layout of your metrics is super important. You need to need to check and double-check if your data is presented in a way that it tells a story. For instance, showing conversion rate is fine but showing a trend how it went over time can be impactful. You may also want to see which referrers are the most valuable to you to aim your efforts on those channels instead of broadly targeting users.
Your Data Studio reports can include
- Top selling products
- Revenue rates by by geography, or device
- Conversion rate by source
- User Segments and demographics by conversion rates
Your dashboards can be shared, it makes a lot of sense to design and provide descriptions to each data point. A bad documentation often undermines the dashboard – even if the insights are obvious.
The Bottom line is…
Data Studio helps make raw data easy to understand for marketing professionals. With Google Analytics and enhanced eCommerce reports you can gain impactful insights on how your products are performing, as well as what marketing channels are working the best and search queries that are worth investing in.
Here at Tatvic, we’re focused on helping eCommerce platforms increase revenue by 20 percent or more with our experts. Want to know more? Schedule a demo with us today![/vc_column_text][/vc_column][/vc_row]
