
A customer goes through different steps while initiating a purchase. Google Analytics primarily shows numbers pertaining to users who dropped out or made a sale, in five steps at the most. It does not showcase customer journeys in the most granular detail.
Companies rely on Google Analytics to gauge the audience and their behaviour through definitive metrics.
But very few businesses know for sure if changes like site design revamp, or the new product presentation triggered a change in their purchasing behaviour. Generating reports based on these scenarios and metrics is a tough ask.
For enterprises looking to understand customer journeys better, Advanced Analysis delivers hard-to-find insights. This feature is yet in Beta phase but is sure to enable companies to spring into immediate action.
- The new data exploration feature enables “instant visualizations” of website data.
- The Funnel Analysis technique provides decision-makers with better visibility into customer actions
- The Segment Overlap feature provides better insight into audience segments
The features are a part of Google Analytics’ efforts to equip website owners with better analytics for extracting business value from their data.
Salient Features of Advanced Analysis
With Analytics 360, enterprises leverage data-driven insights to understand customers better. Marketers often need to slice and dice data in unique & insightful ways to analyze them when subjected to diverse metrics and dimensions.
This approach of deep analysis can be challenging since it needs organized information sources. The derived data from different customer touch-points makes the data synthesis quite difficult.
With Advanced Analysis, marketers have a flexible and intuitive feature to gauge customer experience. Featuring detailed analytical capabilities and better depth in reporting, Advanced Analysis reveals key insights for business. It also offers audience discovery options with granular segmentation. It introduces a plethora of variables to determine primary customer segments too. You can address questions such as
- How do users who have not checked out differ from those who purchased a product from the site?
- Does a specific device or browser impact users and their purchasing behavior?
- Does the audience consist of new or returning customers? Are they from India or elsewhere?
Three Reporting Tools of Advanced Analysis
Advanced Analysis comprises three reporting tools primarily:
- Exploration
- Segment Overlap
- Funnels
The Advanced Analysis Homepage
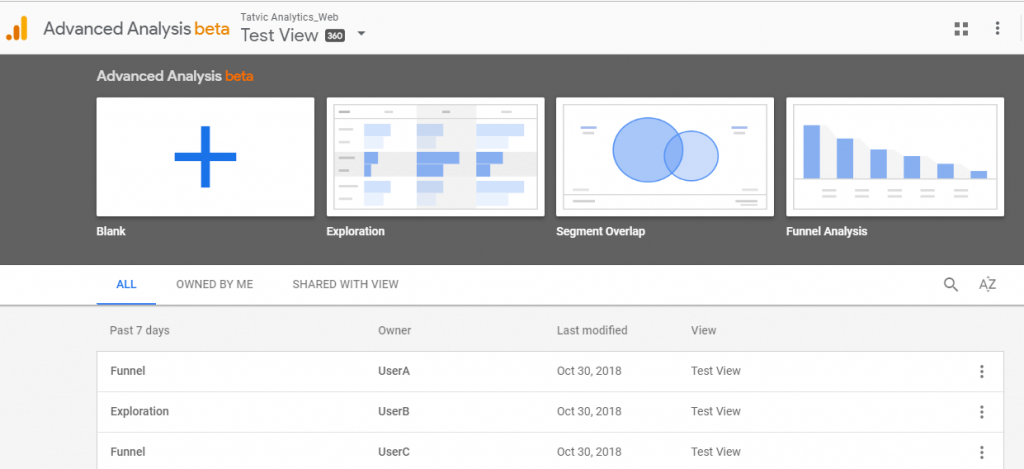
The Advanced Analysis Homepage
The Advanced Analysis homepage resembles the Data Studio homepage, with a smart dashboard inclusive of all reporting tools.
To begin the analysis, one can choose a predefined template from each of the reporting tools. If you want to create a custom report, select “Blank.” You can view all created reports under “All” or “Owned by Me.” The upper left-hand corner includes GA Account name, Property, and View that is currently selected for analysis. One can change the view for the same organization, from the upper left-hand drop-down box. You can even switch between multiple organizations by clicking the ‘Organization’ icon.
The Variables Pane
The Variables pane across the Advanced Analysis reporting interface lets you add more tabs to your report.
- Define the date range for the analysis and compare two periods.
- Below the date range, the Segments section specifies the diverse criteria for the reports. If you use a specific template, there are some preloaded segments but one can add more with the Plus sign. Choose segments accessible in your Google Analytics – up to 10 segments at any given point of time.
- In the Dimensions and Metrics section, one can add up to 15 dimensions and 10 metrics in the pane at any given point of time.
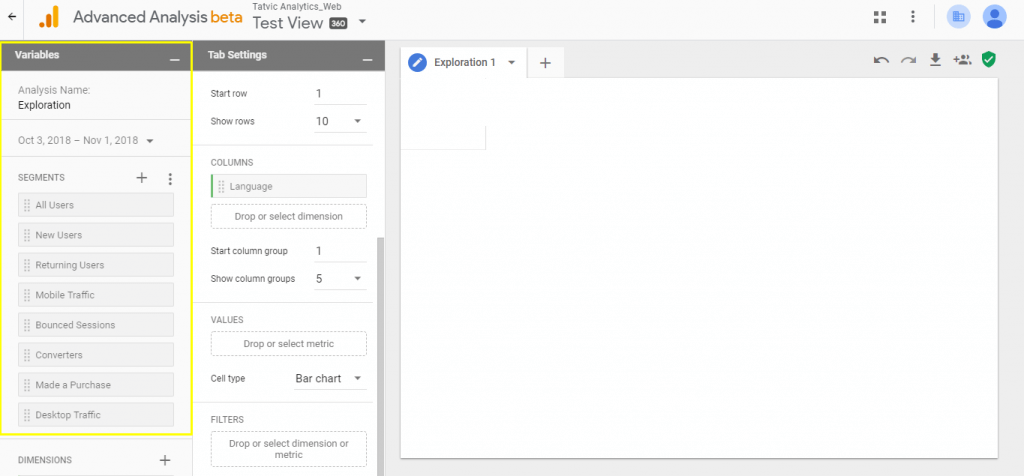
The Variables Pane
- You can add Segments, Dimensions, or Metrics to the resulting reports; double-click them or drag-and-drop them to the main window.
A.The Exploration Report
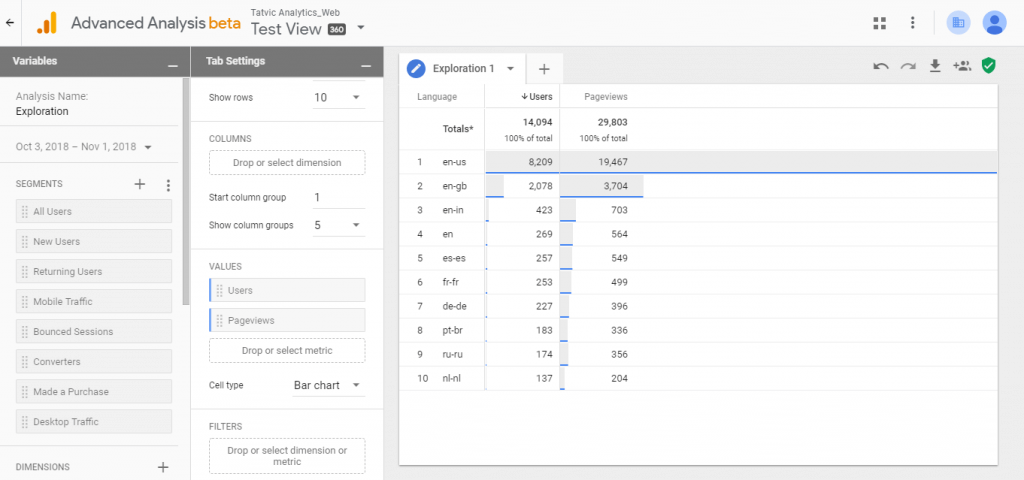
The Exploration Report
Perform deep analyses in a few clicks. Drag and drop diverse variables like dimensions, segments, and metrics to visualize datasets, within a single, specific view. Multiple tabs can present separate views for specific queries while comparing insights across those views.
The Exploration Report resembles a standard Google Analytics report, but with better data analysis. Standard reports include primary and secondary dimensions only, while Advanced Analysis allows users to interact within 5 nested rows and columns. Analysts can pivot the table, modify rows/columns, change visualization style from tabular to a pie chart to a line graph, and more. The Exploration report thus presents a fantastic point to commence analysis.
Data interactions through the Exploration Report
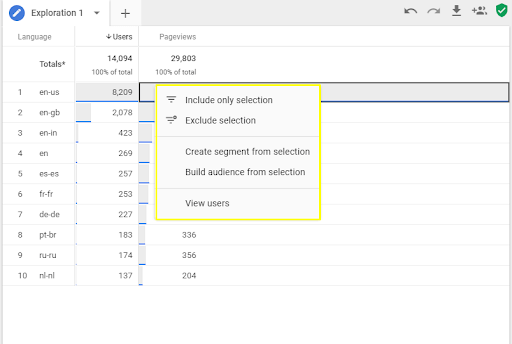
Right-click values in any view to open up the Interaction menu
It is simple to interact with data through the Exploration report.
- Simply right-click on a data value from the table or any other graph, to know the options. Include or exclude a data selection and then filter onto the tab settings to update the same.
- Secondly, you can “Create segment from selection” to add another segment on the Segment panel for analysis. One can even use the segment in Google Analytics.
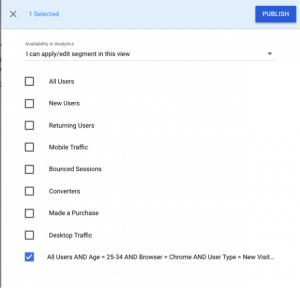
Publish Segments for use in Google Analytics
- Build audience from selection – Create audiences from the selection with a subset of users.
- Explore user detail in your data subset by selecting “View users” to view the user explorer report.
B. The Segment Overlap Report
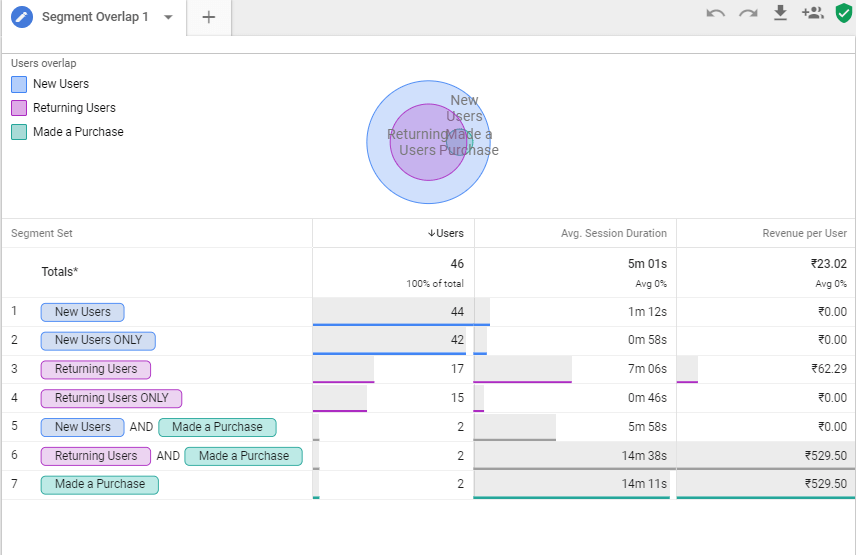
The Segment Overlap Report allows users to visualize the intersection of segments with one another (up to three segments at a time).
The Segment Overlap Report
The top-most metric in the “Values” pane, determines the segment overlap in comparison of other metrics mentioned in the pane. Check out intersection points of different audience segments to reveal overlaps. For example, you can see the return of first-time visitors after they purchased something from the site. This is helpful when one needs to understand user behavior and how it leads to conversions.
One can view the values for each segment by hovering over them. One can switch between the default “Users” metric and Sessions, Transactions, or other metrics.
Add dimensions to the “Breakdowns” shelf to witness real-time report changes. Also, right-click on specific segments or data values to create independent segments, filter criteria, audiences, and users.
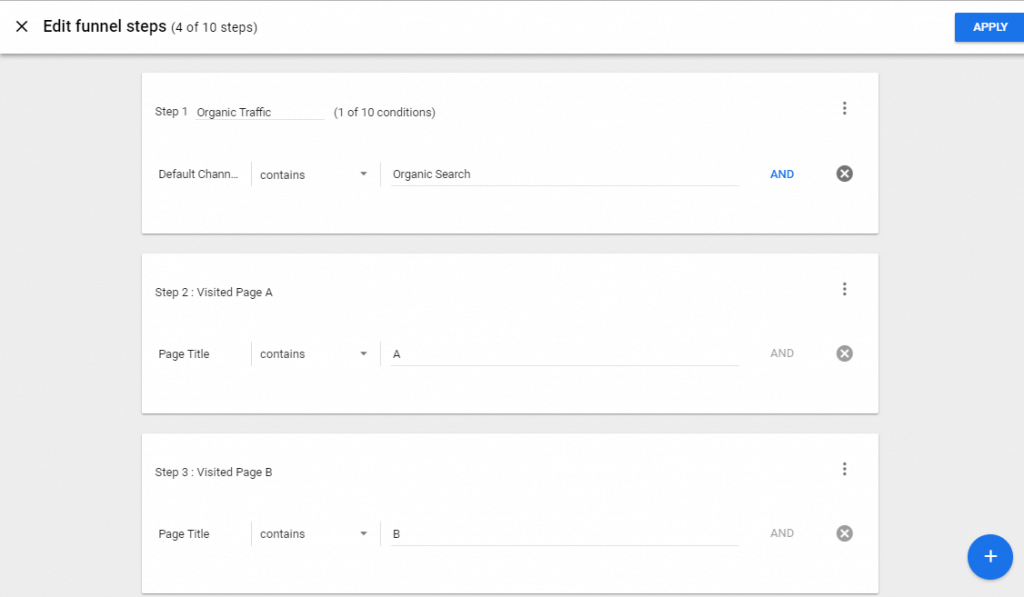
C. The Funnel Analysis Report
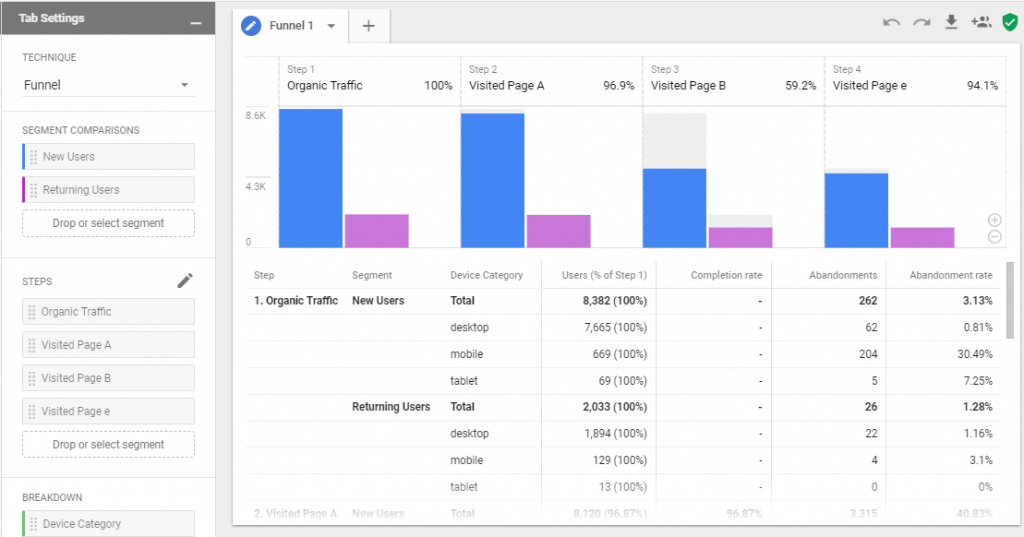
The Funnel Analysis Report is useful for customer journey analysis. Google Analytics 360 hosts the Custom Funnels feature too but one can define only up to 5 steps. Advanced Analysis boosts the number to 10, driving the depth of analysis to a large degree. Compare how different audience segments navigate through your site, and use the data insights to optimize customer journeys better to drive more conversions.
The Funnel Analysis Report
Apply an independent color to each segment in the funnel. The funnel analysis report consists of the same functionality for creating segments, building audiences, and the like, as in other reports. You can even target users who dropped off from the funnel in between steps, by building a custom audience for retargeting purposes, through Google Ads and Video 360.
Advanced Analysis Funnel Analysis Reports
Define the steps of your funnel, with help of the pencil icon in Tab Settings. The funnel includes metrics to define custom steps unlike the similar feature in Google Analytics 360.
Also, all funnels are “closed” funnels here, since users need to be present right from the first stage of the funnel and then strive for further qualification. The customization options are limited too compared to Custom Funnels.
Conclusion
Advanced Analysis offers major benefits for enterprise organizations who are keen to leverage analytics better. Get actionable insights that can help your business to deliver better customer experiences. Once you derive insights, build custom audiences, and experiment with site changes, you are ready to make critical business decisions successfully. Learn more on how advanced analysis in GA 360 can work wonders for your business by contacting us here
