Hello There!

Lorem ipsum dolor sit amet, consectetur adipiscing elit,

Enhanced Ecommerce Custom Dimensions Can be Used as what?

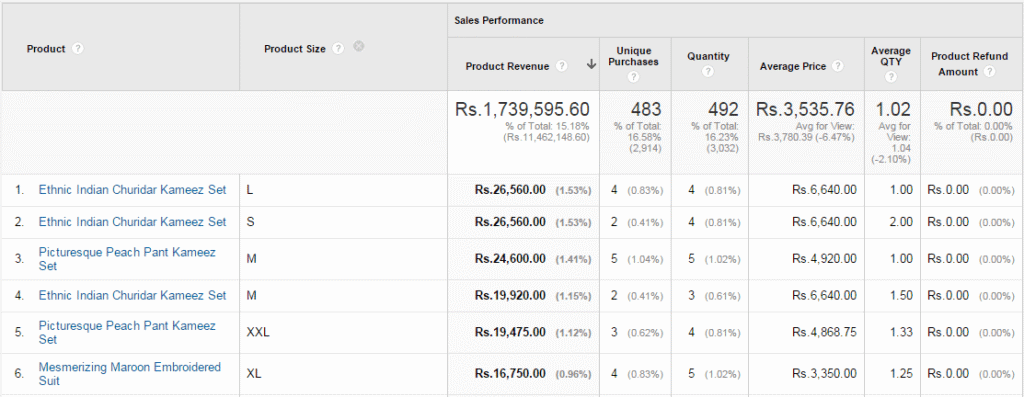
EE Report with Product Size as Secondary Dimension

Google Analytics has come up with a brilliant feature for creating your own custom dimensions and metrics. Custom dimensions are functionally very similar to custom variables, both features enable you to group your data in new ways by applying values to hits based on a scope that you define. However, custom dimensions of Ecommerce are more flexible since it allows you to edit the name and the scope in your property settings without modifying the code.

The introduction of Enhanced Ecommerce in Google Analytics has helped us get detailed product-related metadata information. Earlier we used to have aggregate E-commerce data only in terms of Revenue, Product Purchased, Avg. Price, Transaction, etc. But that’s history now since Enhanced Ecommerce adds dimensions like Brand, Coupon Code, product Variant, etc. in Google Analytics reports that allow us to get important granular level data in Google Analytics. We have covered how these are useful in analysis in our earlier blog post.

Today, we will be describing how to use Google Analytics eCommerce Custom Dimensions & Enhanced Ecommerce to learn which product size & color is popular with your customers.

Product Size and Color data in Google Analytics:

We understand that you have already implemented Enhanced Ecommerce on your store. If your store is WooCommerce, Magento & Shopify then you can save a good amount of your time in implementing the complex EE code by using our Plug & Play EE extensions.

[Tweet “Implement Enhanced Ecommerce using Free Extensions from Tatvic”]

With the use of custom dimensions, you can get product metadata such as Product Size, Color, review count, review score, etc. information right into Google Analytics.  Follow the steps below to create custom dimension product color & size:

How to create Custom Dimension Product Size & Color?

  • Login into your GA as Admin
  • Click on the Admin Tab & Navigate to the property to which you want to add custom dimensions
  • In the Property column, click Custom Definitions, then click Custom Dimensions
  • Click New Custom Dimension
  • Add a Name (In our Case Product Size & later Product Color)
  • Select Product as Scope
  • Check the Active box to start collecting data and see the dimension in your reports right away
  • Click Create

Product Size & Color Custom DimensionUsing Enhanced E-commerce to Generate Insights:

Enhanced E-commerce reports provide you with product-level data such as Add to cart, Cart to Detail rate, Buy to Detail rate, and Purchases. Now you can combine custom dimension data with EE data to generate the following valuable insights:

[Tweet “Generate Valuable Insights for your Ecommerce Store using Custom Dimensions & Enhanced Ecommerce”]

  • Which is the most popular color for your products?
  • Which color has a higher add-to-cart?
  • Which sizes are the most sought-after sizes for each product and give you high revenue?

EE Report with Product Color as Secondary Dimension(Product Performance Report of EE with Product Color as Secondary Dimension)

EE Report with Product Size as Secondary Dimension

(Product Performance Report of EE with Product Size as Secondary Dimension)

These insights can lead us to follow potential actions:

  • Which product color to promote in a marketing campaign
  • Which color should be used as the product image
  • Which product’s size and color should be pre-stock in a higher quantity

We hope the post helps you understand how you can use Enhanced Ecommerce with Custom Dimensions to discover popular product colors & the size of your store.

How to Use Enhanced Ecommerce of Google Analytics to Measure Product Demand?

Product Demand Analysis Thumbnail


Product Demand Analysis ThumbnailActionability of data is always a concern for all the stakeholders of the company including the business owners, Marketers, Analysts, and Ecommerce product managers.

As I explained in my last blog post, Enhanced Ecommerce in Universal Analytics has opened a whole new world with powerful insights but still, the question remains - what actions business owners can take from these insights to generate more revenue?

One of our eCommerce clients raised the same concern when we implemented Enhanced Ecommerce on his store. The client wanted to analyze the performance of his products in terms of their demand and revenue & use the insights generated to improve their product placements, Marketing efforts, and profit margin.

We then carried out a Product Demand analysis for the client in which we used the Products Performance report of Enhanced Ecommerce to calculate product demand. We combined the product demand with product revenue data we generated several actions which had the potential to optimize the client’s revenue.

(Quick Note: You Might want to check out our Google Analytics Plugin for WooCommerce, Magento & Shopify)

In the following blog post, I will walk you through what is Product Demand Index, How the product Demand index is calculated, and what actions you can take from the analysis.

Quick Navigation:

What is the Product Demand Index?

Customers interact with the product offerings in various ways - Product View, Add To Wishlist, Add To Cart, and Buy.

If we were to understand the demand for each product in our inventory, each of these metrics taken in isolation would give us only an incomplete picture of the demand. But taken cumulatively, we get a more accurate view of demand as represented by customer actions. We call this cumulative metric the Demand Index.

More specifically, the Demand index is defined as a rank given to each product based on various metrics that indicate its popularity such as Pageviews, Add To Carts, Add To Wishlist, and Purchases.

Demand Index= Ratio of PVs to Unique PVs + CTDR + BTDR + Add To Wishlist rate

Where,

  • CTDR= Cart To Detail Rate is the ratio of Add To Carts to Product Detail Views
  • BTDR= Buy To Detail Rate is the ratio of Unique Purchases to Product Detail Views
  • Add To Wishlist Rate= No. of Add To Wishlists/ Product Detail Views

These four data points are collected for each product.

How to arrive at the Product Demand Index?

Arriving at the product demand index is fairly easy and you can calculate the same by following the instructions mentioned in the below 4 steps:

Step 1:

To arrive at Product Demand, first, collect the following data points from the Enhanced Ecommerce product performance report. You need to collect some data points from other reports as well:

  • CTDR
  • BTDR
  • Add To Wishlist Rate
  • Ratio of PV/UPV
Step 2:

Next, add all the above data points to arrive at the product demand Index as shown in the above formula. Now based on their Demand Index give them the Demand Rank. (Higher the Demand Index, Higher the Rank)

Step 3:

To arrive at the sales rank, give each product a Rank based on product revenue metrics. (Higher Product Revenue, Higher the Sales Rank)

Step 4:

Once you complete the above steps, your table will look like this:

Enhanced Ecommerce Product Demand Analysis

* This calculation has been carried out for the Sample data set to show here as an output example

What Insights/ Actions Items You Can Generate from the Product Demand Analysis?

Till now we have seen how you can calculate demand and sales rank for each product based on Enhanced Ecommerce and other analytics data.

But the most important question here is what insights you can generate from this data and what actions you can take from it.

To generate the insights, categorized your products into a 2*2 matrix using Demand and Sales Rank and once you do that following are the set of actions you can take for each of these products:

Demand & Sales 2 by 2 matrix for products

Product with high Demand but low sales

If your products fall in this quadrant, the following actions can be taken:

  • For such products where high demand is not resulting in sales, ecommerce store owners can provide discounts in order to increase the sales
  • Another action that can be taken for such products is to increase the Review score as for most of the e-comm. Much research shows a positive relationship between Product Reviews and Purchases. One such research from iPerceptions shows that 63% of customers are more likely to make a purchase from a site that has user reviews.
  • A High Demand indicates people are browsing the product, adding it to the cart, etc but that is not resulting in a sale so as an advanced analysis we can try to make a funnel for such products and understand where they are dropping off.

Products with high Sales Rank and Low Demand

If your products fall in this quadrant, the following actions can be taken:

  • From the analysis, you can also identify products with high sales rank but lower demand rank. It means that this product if given more exposure can lead to a higher demand rank and to improve the demand rank following actions can be taken
    • Such Products can be placed at prominent positions on the Category Listings so that their CTR increases. Such products can be highlighted via various product listings such as Recommendations

Products with high Demand and Sales Rank

If your products fall in this quadrant, the following actions can be taken:

  • Other actions that can be taken from this analysis are Changing the prices of the products with higher demand and sales rank to achieve a higher profit margin. I know that the price optimization of the products is much more complex but its certainly an option that we can consider

Other Actions

  • Comparing week-by-week performances of products can also lead to several insights and actions
  • For the products for which demand rank is showing a significant decline over the period of a couple of weeks and thus also affecting the sales rank, emails or referral campaigns can be run to improve the exposure

So, this is an overview of Demand Index Analysis through which you can generate actionable insights for your eCommerce store.

I’d highly appreciate your viewpoint on this if you have carried out something similar for your store/client. Also, I am sure that you have already thought about some other metrics that can be included in the Demand Index, please share them and it help us in making the index more meaningful. 🙂

Happy Analyzing!

Interested in learning more about Enhanced Ecommerce? Check out our Post - 32 Resources to Help You Become an Expert at Enhanced Ecommerce

Bot Icon
Bot Icon

Tatvic Bot

Explore About Tatvic and Services