In our previous webinar, we discussed on predictive analytics and basic things to perform predictive analysis. We also discussed on an eCommerce problem and how it can be solved using predictive analysis. In this post, I will explain R script that I used to perform predictive analysis during webinar.
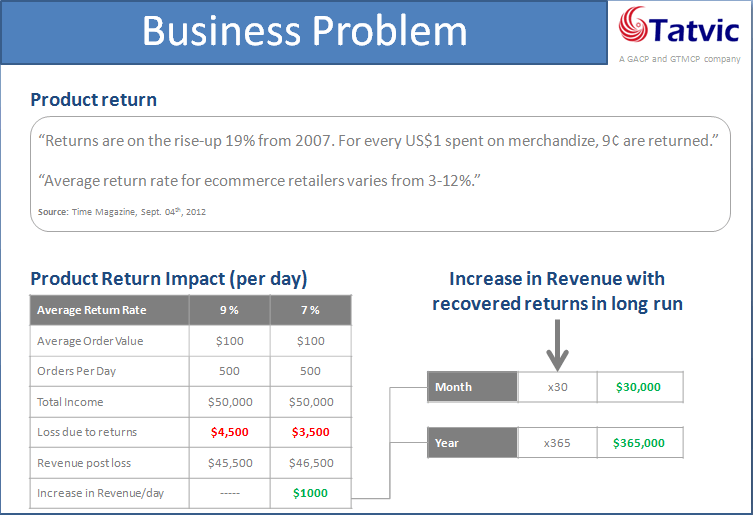
Before I explain about R script, let me recall eCommerce problem that we discussed during webinar so can get better idea about the data and R script. For eCommerce retailers product return is headache and higher return rates impact the bottom line of their business. So if return rate is reduced by a small amount then it would impact on the total revenue. In order to reduce return rate, we need to identify transactions where probability of product return is higher, if we can able to identify those transactions then we can perform some actions before delivering products and reduce the return rate.
In webinar, we discussed that we can solve this problem using predictive analytics and use Google Analytics data. To perform predictive analysis we need to go through modeling process and following are the major steps of it.
- Load input data
- Introducing model variables
- Create model
- Check model performance
- Apply model on test data
I have included these steps in R script. So, let me explain R script that we used in webinar. R script is shown below.
# Step-1 : Read train dataset
train
# remove TransactionID from train dataset
train
# Step-3 : Create model
model
# Step-4 : Calculate accuracy of model
predicted
#Step-5 : Applying model on test data
#Load test dataset
test
#Predict for test data
test_predict
#creating label for test dataset
label
# set label equal to 1 where probabilty of return > 0.6
label[test_predict>0.6]
# attach label to test dataset
test$label
# Identify transactionID where label is 1.
high_prob_transactionIds
high_prob_transactionIds
As you can see that first step is load input data set. In our case input data are train data and train data are loaded using read.csv() function. Train data contain the transaction based data and it contains TransactionID. TransactionID is not needed to use in the model, so it should be removed from the train data.
We also discussed about the variables during the webinar. Train data include pre-purchase, in-purchase and some general attributes. We can retrieve these data from the Google Analytics.
Next, model is created using glm() function and three arguments are given to it which are formula, family and data. In formula, we specify response variable and predictor variables separated by ~ sign. Second argument we set family equal to binomial and last we set data equal to train. Once model is created, its performance is checked where accuracy of the model is calculated. it is shown in the script.
Finally, model is applied on the test dataset and predict the probability of the product return for each transaction in test dataset. In the script, you can see that I have performed several steps to identify the transactionIDs from test data having higher probability of product return. Let me explain them, first test data are loaded. Second, predict() function is used which will generate the probabilities of product return and store in test_predict. Third, new variable label is created which contain 0 for all transactions initially and then using test_predict variable, 0 is replaced with the 1 where probability of return is greater than 0.6 or 60%. Now this label is attached to the test data. Finally all the transactionIDs are retrieved where label is 1 which means that probability of product return is greater than 60% in these transactionIDs.
So this is the script which I used during the webinar and performed the predictive analysis. I have created dummy datasets which you can use to perform these steps yourself. You can download data and R script from here
Here I want to share you one thing, this is not optimized model. This is a practice model. You can improve the model by taking other variables from Google Analytics or performing some optimization tasks, so you can get better results. However if you want to look at some other predictive models on web analytics tool data click here