For eCommerce business, the most important business objective is to increase the conversion/User spends and ROI of the business. To do that it is of utmost importance that you analyse your data and make data-driven decisions because you just don’t want to waste your hard-earned traffic on a plethora of multivariate tests that just won’t contribute to increasing your conversions.
After all, you’ve spent a lot of time and resources growing your business.
But the question might arise, How do I get data and analyse it to make business decisions?
Considering you are already a Google Analytics user, It comes with a lot of default reports that you can use to analyse and make data-driven decisions.
If you are running an eCommerce business, then a big congratulations!
 Because Google Analytics comes up with a dedicated section designed for eCommerce clients which provides you with all kinds of eCommerce reports that you have ever thought of. It includes conversion funnels starting from user acquisition to conversion action. Using this you can analyse all the data points which you might ever need. Check those reports under the Conversions → Ecommerce section.
This analysis can lead you to pinpoint areas that are not working too well. Going deep inside will reveal the most likely problems. This will narrow down the changes and improvements you can make with your eCommerce optimisation strategy.
Sounds easy? It is never that easy.
Don’t worry! We are here to help you.
There are 5 most important default reports, that you can never miss on to dig down further and identify the data points like drop off of the users in their journey towards the final conversion, The performance of an individual product or product categories into the conversion or the source/Medium or Campaign that are driving the most conversions and much more.
Check the analysis that you can make out of those reports and how to use that as follows:
Shopping Behaviour Report:
Access: Conversions → Ecommerce → Shopping Behavior
First of all, having overall knowledge of the key touchpoints of the user journey is very important in order to identify the gaps and potential areas of improvement to increase the conversion rate. This identification starts with analyzing the journey of users and key drop-off points while carrying the users from the acquisition stage to the final conversion stage.
The Shopping Behaviour report plays a key role in identifying the key touchpoint from where the user abandons the website before converting. The report covers journeys starting from total user visits to product detail page visits and at last transacting on the website.
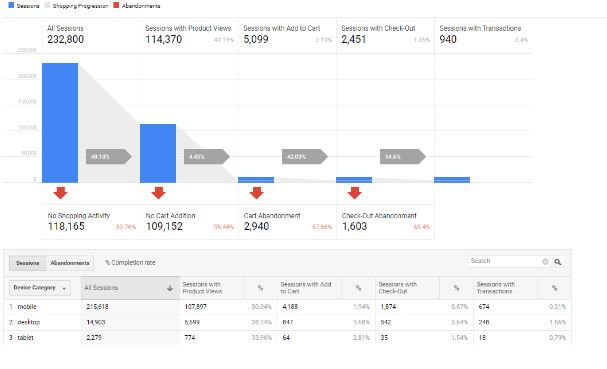
In the above screenshot, you can see that the maximum number of drop-offs is happening between the product detail page and add to cart stage, out of which the mobile device is showing the highest drop-off.
Now, the questions still remain, apart from overall website drop-offs, what else can this report answer. Well, don’t worry. The Shopping Behaviour report can also help us with the following questions.
- Which device is performing worst on which step?
- Which channel drives visitors to the first step, but not much further?
- Do we have any browser issues at a certain step?
Once these pieces of information are available, you can create remarketing audiences to increase conversions which act as the first step for increasing conversions.
Product Performance Report
Access: Conversions -> Ecommerce -> Product Performance
While analyzing the touchpoints from where users tend to drop off from the website, it is very important to get the information of the product level granularity. In order to increase conversion rate, it is necessary to optimize the eCommerce store by measuring the performance of products viewed and purchased, product list views visited the most by the users, along with the optimization of the website experience, so that users get the most out of each journey done on the website.
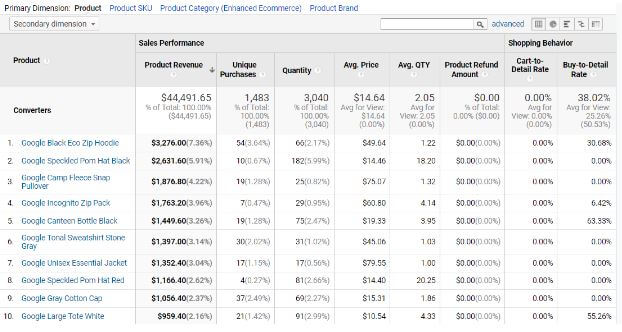
In the above screenshot, as you can see that only a handful of the products are generating the maximum amount of revenue. It’s great news that we are aware of the top-performing products, it is also important to be aware of the low performing products and by checking the Cart-to-Detail Rate and Buy-to-Detail rate columns you can see which products are likely to sell well if promoted.
By analyzing these reports, you can devise further campaigns to show the desired products to users to increase the conversion rate.
Funnel Visualization Report
Access: Conversions -> Goals -> Funnel Visualization
Users go through a journey before buying something from your store and converting. This process, or path, can be visualised like a funnel. As there are many steps, there are many ways your funnel could have a leakage. This report gives you an on-point view of the conversion path and the data of each step.
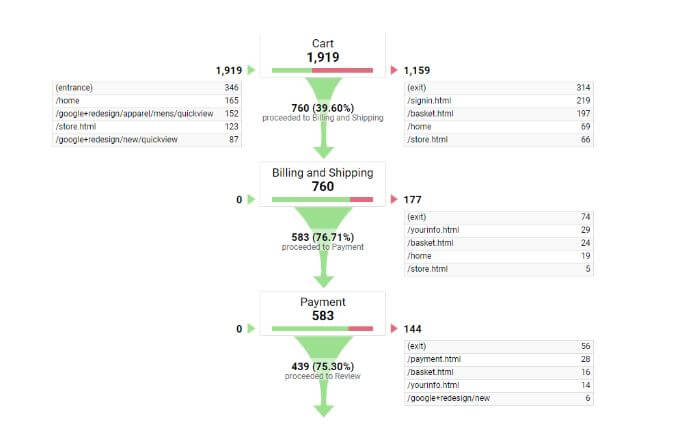
This report will not tell you why they exited but it’ll give you a clear view of where they exited.
You can always use this information to know what exactly happened before they exited the page.
- Check the content
- Look for bugs
- Check for technical problems
Or anything that might create friction in user experience while buying.
Don’t just start at the first step, go step by step – starting from the place in the funnel that has the lowest users on the page and proceeding forward.
Landing page, Source medium and campaigns report
Access: Behavior -> Site Content-> Landing Page
Access: Acquisition -> All Traffic -> Source / Medium
Access: Acquisition -> All Traffic -> Campaign
As you all know that all the eCommerce merchants are continuously running multiple campaigns simultaneously in order to increase brand name, product visibility to the multiple audiences and increase transaction volume as the key objectives. Although you can understand the overall website performance and product performances from the above reports, measuring the campaign performance also plays a key role in improving the conversion rate.
But, how to measure the performance of the campaigns run for each brand?
This can be done by analyzing three main reports i.e. landing page report, source/medium report and campaign report.
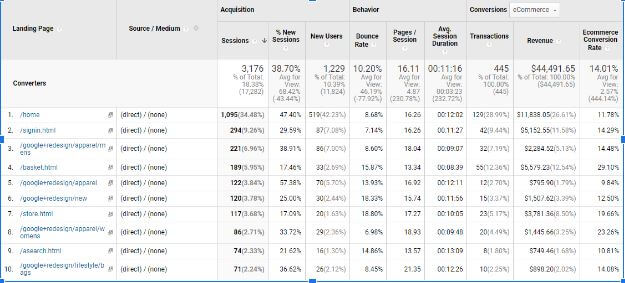
With the use of the Landing page report, You get an idea of the first-page user visited on your website/App and how many of them finally converted and the amount of revenue that they generated.
Use source/Medium report to get an idea of the source/medium which is driving the most traffic to the website and influencing the conversions and revenue.
With the help of a campaign report, you get to know the effectiveness of your campaign and the revenue and conversions that the specific campaign generates.
Site search reports
Access: Behavior -> Site search
Being an eCommerce business, your website/App will be having in-app/website search functionality. To track the performance of the search terms which are driving users to engage more on your website/app or driving more conversions, you can do all of it through site search reports available in GA.
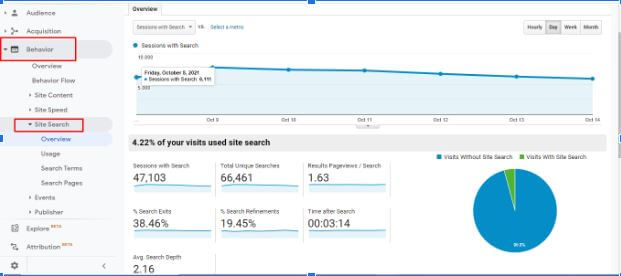
With the help of this report, you get insights on how much time users spent, which pages are visited or directly exited after writing a specific search team. You also get an idea of the number of visits with or without site search or how many times the search refinement was done after the user search and so on.
The Bottomline is…
Google Analytics is a wealth of data available for you to increase conversions. While the reports we’ve mentioned here aren’t the only reports you should see but they should be at your top priority. There are a plethora of metrics and reports available in GA and you should track metrics that align with your business goals.
These reports can help you make data-driven decisions that will certainly provide much-needed momentum to your conversions.
To know more on how to optimise GA for your eCommerce store, get in touch with one of our representatives today!