This post aims to develop an understanding of how to calculate product-specific conversion rates and discuss the potential analysis & insights that can be generated from it.
Quite often the business problems or questions that most e-commerce websites encounter are one of the following:
- How much product to stock?
- Which products are fast-moving?
- How can I move some of the products quickly?
- How to measure how many views different products have received?
- Are the product views turning into transactions & revenue? What actions can I take based on such data?
What is the product conversion rate?
There are many ways to define what we can call the product conversion rate. For example, you can check the number of transactions for any given product divided by the number of visits to that specific product. Moreover, you can also use the quantity to no. of visits ratio to calculate the product conversion rate.
Based on the product conversion rate, an automobile e-commerce website was able to update its recommendations section, which in turn led to a 20% increase in transactions.
For our understanding, we will use the ratio of quantity sold to the no. of visits for the different products as a product conversion rate.
Why product conversion rate?
There are many ways to define what we can call the product conversion rate. For example, you can check the number of transactions for any given product divided by the number of visits to that specific product. Moreover, you can also use the quantity to no. of visits ratio to calculate the product conversion rate.
Based on the product conversion rate, an automobile e-commerce website was able to update its recommendations section, which in turn led to a 20% increase in transactions.
For our understanding, we will use the ratio of quantity sold to the no. of visits for the different products as a product conversion rate.
How to get data from Google Analytics?
There are two approaches that can be used for obtaining the data for product views:
Approach 1: Ecommerce / Enhanced Ecommerce:-
Here is the syntax that you can use to generate product views statistic in event tracking:
- Event Category: Enhanced Ecommerce
- Event Action: Product Detail View
- Event Label: {{current page path}}
This needs to fire on all your product pages in Google Analytics.
As a result of this, you will be able to create a custom report with “Product” as the dimension, and “Product Detail Views” as the metric.
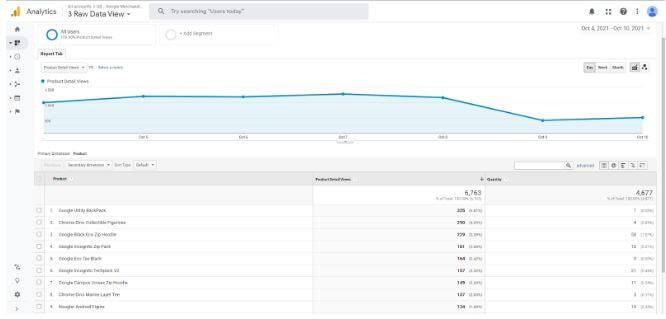
Report Image Source: Google Merchandise Store
Approach 2: Custom Events Implementation:-
You can implement the following data layer snippet to pass an event every time a product detail page is loaded.
- Event Category: Product Detail View
- Event Action: {{Product Name}}
- Event Label: {{current page path}}
Based on this implementation, you will get the Product Names in your event tracking report. You will not need to go through the process of implementing E-Commerce tracking on your website, and will still be able to get unique product views as well as total product views of each product.
By putting this data together, here is what you can get as an output for different products. Please note that in the third column you can create conversion rates for your different products.
| Product Name (based on Event Action) | Unique Views (based on Unique Events) | Quantity Sold | Product Conversion Rate | Product Revenue |
|
Google Utility BackPack |
260 |
9 | 3.46% | 2231 |
|
Chrome Dino Collectible Figurines |
658 |
29 | 4.41% |
1840 |
| Google Black Eco Zip Hoodie |
713 |
27 | 3.79% |
1721 |
|
Google Incognito Zip Pack |
322 |
35 | 10.87% | 1611 |
|
Google Eco Tee Black |
133 |
15 | 11.28% |
1364 |
|
Google Incognito Techpack V2 |
413 |
15 | 3.63% | 1160 |
|
Google Campus Unisex Zip Hoodie |
142 | 17 | 11.97% | 1119 |
| Chrome Dino Marine Layer Tee |
300 |
12 | 4.00% | 1079 |
| Noogler Android Figure | 250 | 20 | 8.00% |
1872 |
| Google Cloud Unisex Zip Hoodie | 129 | 24 | 18.60% |
1654 |
Some of the products have a high conversion rate as shown in highlighted portion. These are your winners.
Plot this conversion data with the product’s revenue and you will be able to analyze various aspects of your product performance indicators, including:
- Know whether high converting products are getting sold or not
- Use the advanced segments to calculate the product conversion rate for different traffic sources
- Figure out low-converting products, reduce them from your stocks and save money from the warehouse!