Welcome to the last part. In the previous blog, we have discussed about the model improvement and seen the summary of the improved model. In this post, I will discuss about regression with Google prediction API, compare it with our regression model and predict the bounce rate. When I used Google prediction API on the our data set, I found following result.
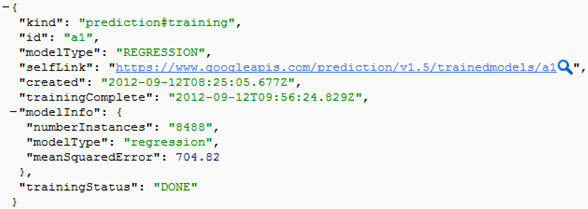
Let’s understand result first. Id of the model is “a1”, model type is “REGRESSSION”, number of instances are 8488(i.e. data set contains 8488 rows) and most important result is mean squared error which is 704.82. Here, there is no information about the coefficients of the model. Then, question arise how to evaluate model? Don’t worry, I will explain.
In the first part, I have explained about cost and if the cost is minimum then model is better. Cost of Google prediction API result is calculated as the square root of the mean square error and it is 26.55. However the cost of our improved model is termed as residual standard error and it is 24.83. If we compare these two costs , then we can say that R regression model is similar to the Google prediction API model.
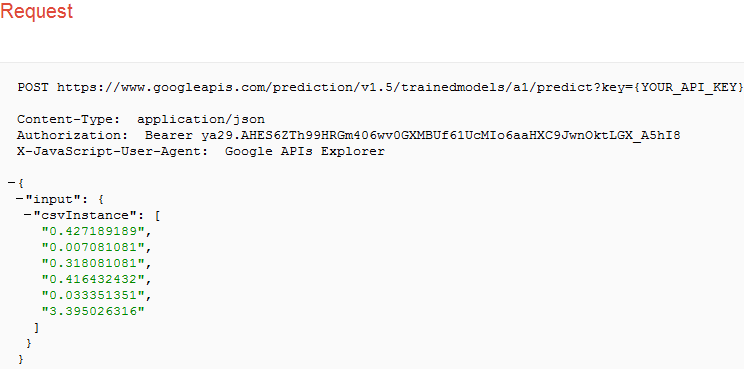
After understanding the relationships between the bounce rate and time components, let’s predict the bounce rate through regression model. R provides predict() function to generate prediction. Suppose we have following observation for a webpage
- avgServerResponseTime – 0.427189189
- avgServerConnectionTime – 0.007081081
- avgRedirectionTime – 0.318081081
- avgPageDownloadTime – 0.416432432
- avgDomainLookupTime – 0.033351351
- avgPageLoadTime – 3.395026316
R code to generate prediction is as follow.
>insert_frame<- data.frame(avgServerResponseTime=0.427189189,avgServerConnectionTime=0.007081081,avgRedirectionTime=0.318081081,avgPageDownloadTime=0.416432432,avgDomainLookupTime=0.033351351,avgPageLoadTime=3.395026316)
>predict(Model_2,insert_frame,type='response')
Output
50.14
Let’s check the prediction of the above observation with Google Prediction API. This is shown below.
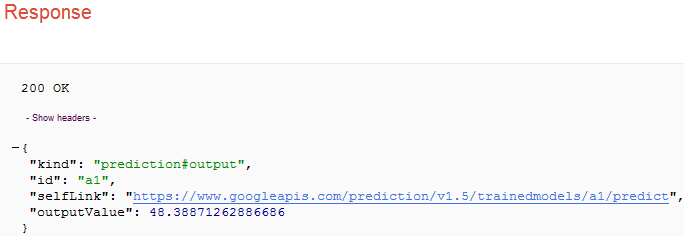
From the above result, we can see that prediction for observation is 48.39 and it is similar to the our prediction model.
Would you like to understand the value of predictive analysis when applied on web analytics data to help improve your understanding relationship between different variables? We think you may like to watch our Webinar – How to perform predictive analysis on your web analytics tool data. Watch the Replay now!